
Figure 5. pH dependence of Log k app1 (M–1 s–1; squares) and Log k app2 (M–1 s–1; circles) for the Ma-Pgb*-Fe(II) reductase activity.
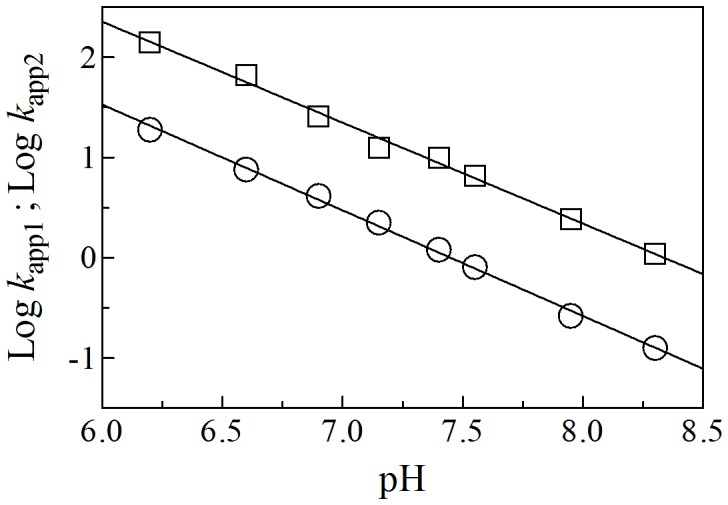
The slope of the continuous lines is: –1.01±0.03 (squares) and –1.05±0.02 (circles). The standard deviation is smaller than the symbol. For details, see text.