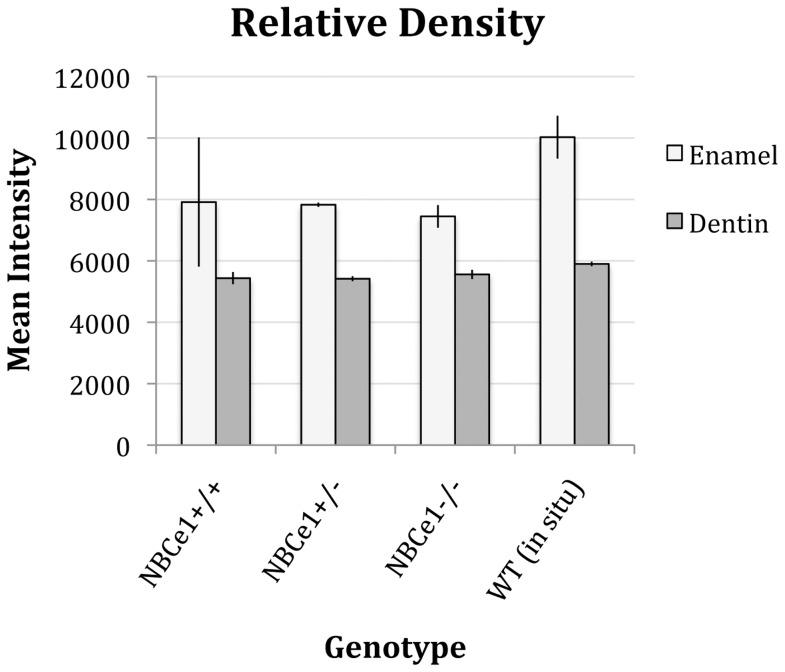
Figure 3. Enamel and dentin relative density measurements.
The densities of teeth grown in the host kidney capsule, indicated by mean intensity value from µCT scanning, were compared across NBCe1+/+, NBCe1+/− and NBCe1+/− groups. Teeth imaged and used for analysis were NBCe1+/+ (n = 5), NBCe1+/− (n = 3) and NBCe1−/− (n = 5). The averages and standard deviations (error bars) were plotted. Two-tailed Student’s t tests were run and no statistically significant difference in either enamel or dentin density was identified between any of the groupings. Refer to Table 1 for raw data.

