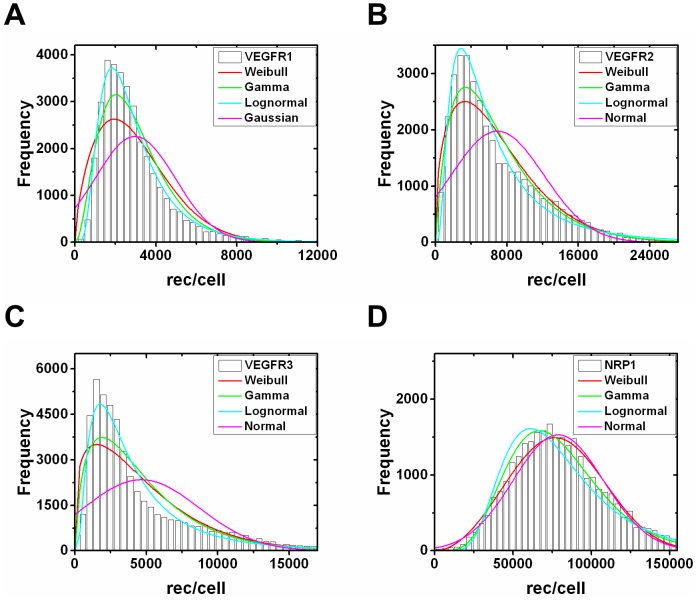
Figure 4. Statistical distribution fits to in vitro receptor populations.
Cell-by-cell analysis of (A) VEGFR1, (B) VEGFR2, (C) VEGFR3, and (D) NRP1 distributions on in vitro human endothelial cells. Each distribution was fit to Weibull (generalized extreme value distribution), Gamma (maximum entropy probability distribution), and lognormal (logarithm is normally distributed) probability density functions. The parameters for the best fit distributions are given in Table 2.

