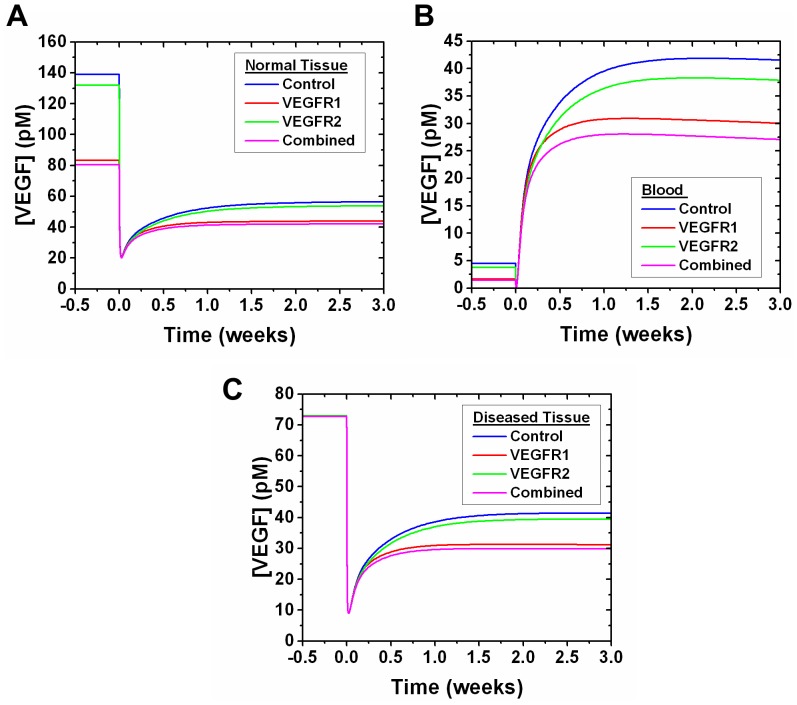
Figure 5. Effect of VEGFR1 and VEGFR2 levels on anti-VEGF efficacy.
Comparison of updating the model by adding experimental VEGFR1 levels only, VEGFR2 levels only, and both compared to the control. Updated VEGFR1 and VEGFR2 values represent geometric means of C57BL/6 distributions (2,100 VEGFR1/cell and 1,540 VEGFR2/cell). The control reflects previously published VEGFR1 and VEGFR2 levels (1,100 VEGFR1/cell and 700 VEGFR2/cell) [23]. Free VEGF concentration is shown in (A) the normal tissue compartment, (B) the blood compartment, and (C) the diseased tissue compartment. An optimized anti-VEGF agent is added at t = 0 and the VEGF concentration response is simulated to 3 weeks after injection.

