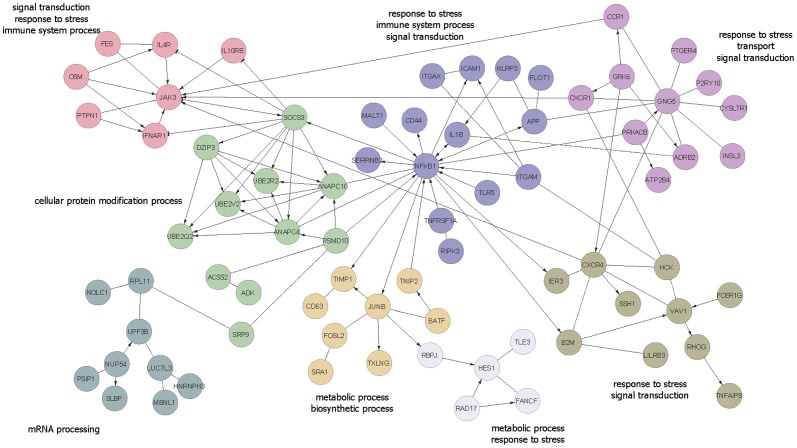
Figure 3. Reactome Functional Interaction analysis of 469 significant genes revealed eight clusters consisting of at least five of genes.
Each cluster is indicated by a different color and their representative GO slim term(s). Edges of “->” indicate activating/catalyzing; “-|” for inhibition; “-” for functional interactions extracted from complexes or inputs and “- - -” for predicted functional interactions.

