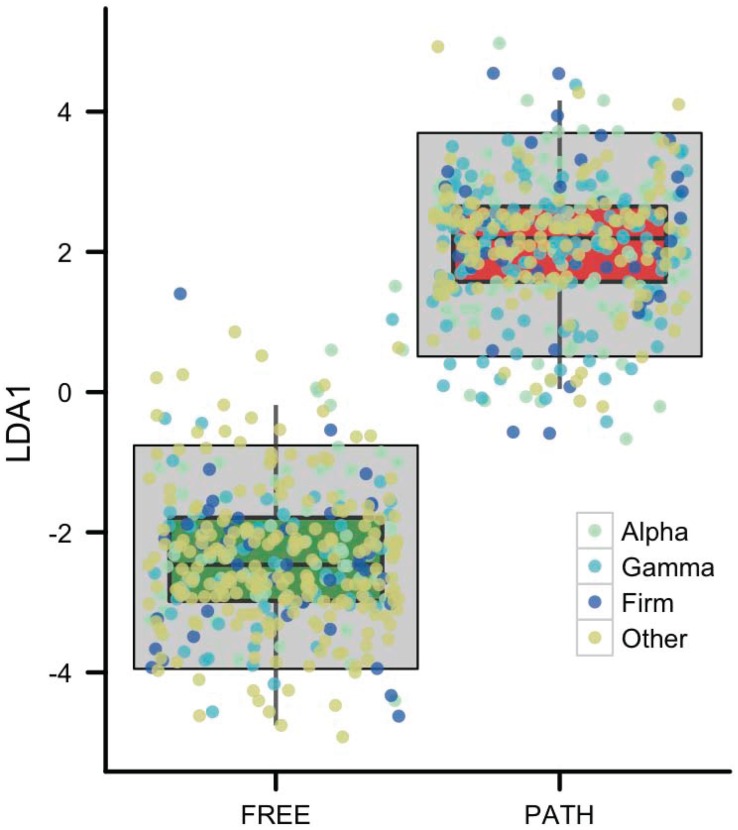
Figure 5. LDA plot with color-coded phylogenetic groups.

Linear discriminant analysis of the repeat bin word distance results (Figure 4) between free-living and pathogen genomes. The gray box represents statistical significance (p<10–6). The points of genomes from the three largest phylogenetic groups in the data set are highlighted to show no phylogenetic significance of differences in groups.
