
Figure 4.
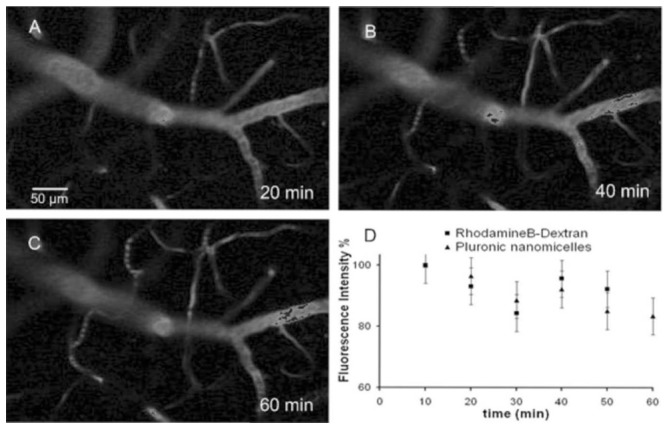
Images acquired at 150 μm bellow the dura at 20 (A), 40 (B) and 60 min (C) after 100 μL Pluronic nanomicelles (10 g.L−1) injection. Figure 4D, shows the decrease of the mean fluorescence signal intensity in all vessels (bars are SD) after injection of Pluronic nanomicelles or 70 kDa Rhodamin B dextran (100 g.L−1).