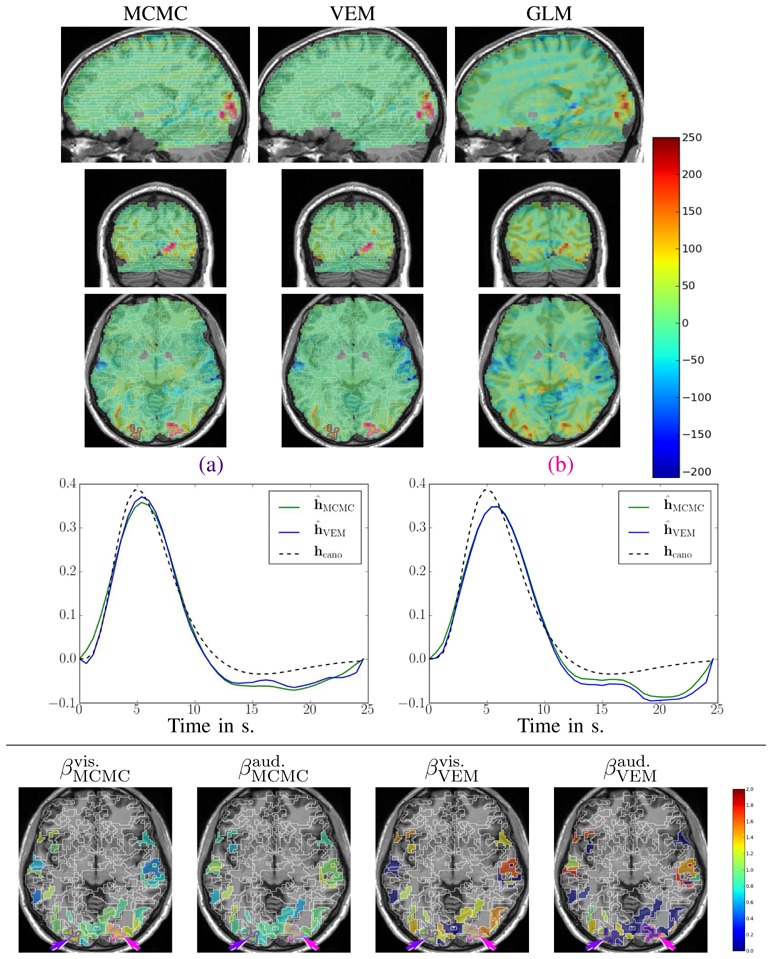
Fig. 12.

Results for the Visual-Auditory contrast obtained by the VEM and MCMC JDE versions, compared to a GLM analysis. Top part, from left to right: NRL contrast maps for MCMC, VEM and GLM with sagittal, coronal and axial views from top to bottom lines (neurological convention: left is left). Middle part: plots of HRF estimates for VEM and MCMC in the two parcels circled in indigo
 and
and
 on the maps: occipital
 and
and
 , respectively. The canonical HRF shape is depicted in dashed line. Bottom part: axial maps of estimated regularization parameters β̂ for the two conditions, auditory (aud.) and visual (vis.), involved in the VA contrast. Parcels that are not activated by any condition are hidden. For all contrast maps, the input parcellation is superimposed in white contours.
