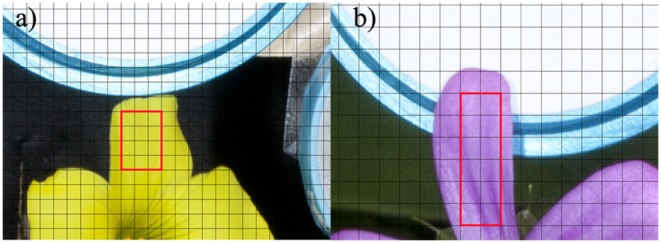
Figure 5. Examples of the two different grid schemes employed to measure local chromatic variability within a petal.

a) Oxalis pes-caprae 4 3 sampling scheme, grid size 40 pixels. b) Geranium sp. 6
 2 sampling scheme, grid size 30 pixels.

a) Oxalis pes-caprae 4 3 sampling scheme, grid size 40 pixels. b) Geranium sp. 6
 2 sampling scheme, grid size 30 pixels.