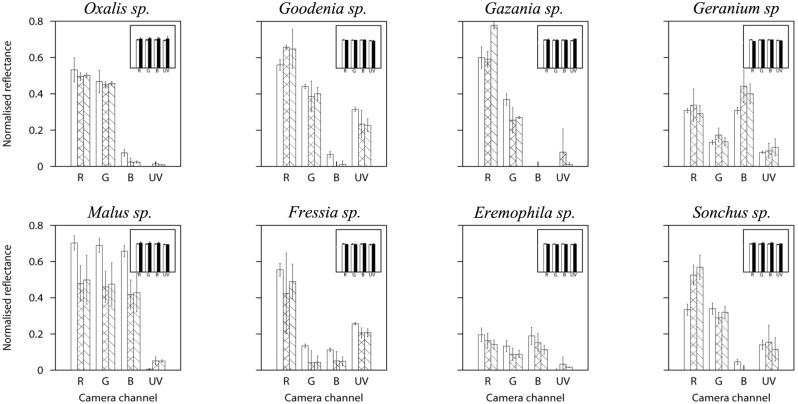
Figure 7. Total reflectance recorded from flowers belonging to the genera Oxalis pes-caprae, Goodenia ovata, Gazania rigens, Geranium sp., Malus domesticus, Fressia laxa, Eremophila macculata, and Sonchus olereaceus by the different colour channels of a Canon 40D and a Fuji S3 UVIR.
Expected camera responses, in reflectance values, calculated from spectrophotometric data and the spectral sensitivity curves of each colour channel (Figure 1) (white bars), camera responses for three 225 pixel2 areas located at the tip, middle and bottom of the petals (cross-hatched bars), and camera responses from sampling areas wider than those covered by a 400 µm standard spectrophotometer probe (diagonal-hatched bars). Figure inserts represent measured and predicted camera responses for a spectrally flat, achromatic standard reflecting about 33% of incident irradiation, which was included as an internal control on each image. Error bars represent standard deviation in all cases.

