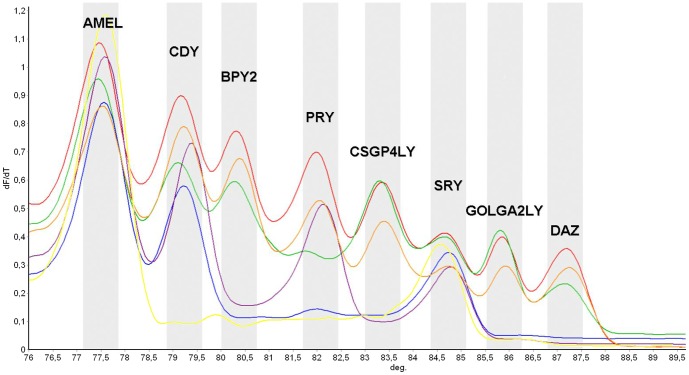
Figure 2. High Resolution Melting derivative (dF/dT) profile for deleted and undeleted samples.
The figure shows AZFa-deleted (orange) and undeleted (red) samples with no gene deletions, AZFb-deleted sample with lack of amplification only of PRY gene (green), AZFc-deleted with no amplification of BPY2, DAZ, GOLGA2LY and CSGP4LY genes (violet), AZFbc-deleted with no amplification of PRY, BPY2, DAZ, GOLGA2LY and CSGP4LY genes (blue), and AZFabc with the sole amplification of AMEL and SRY genes (yellow), as evidenced by the corresponding missing peaks.

