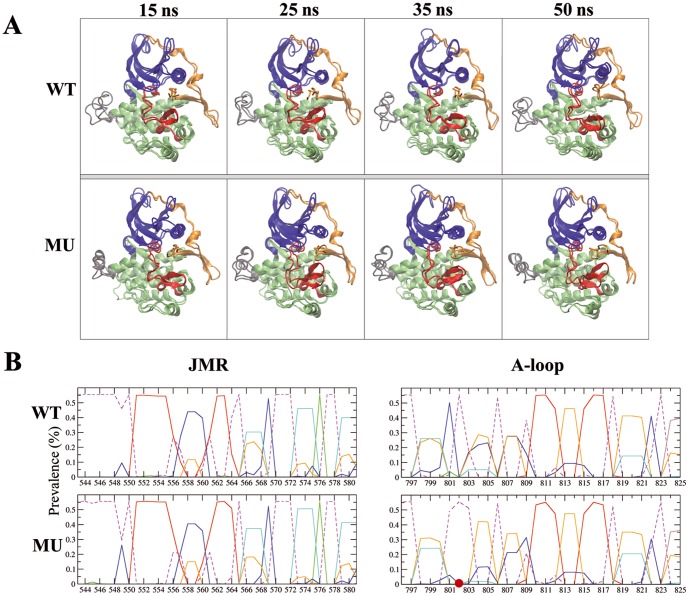
Figure 3. MD conformations of CSF-1R cytoplasmic region in the native protein and its D802V mutant.
(A) Ribbon diagrams display the proteins regions or fragments with different colors: JMR (orange), A-loop (red), N- and C-lobe (blue and green), and KID (gray). Snapshots taken from the two MD replicas at 15, 25, 35 and 50 ns for CSF-1RWT (top) and CSF-1RMU (bottom) were superimposed by pair. Superposed conformations were selected by RMSDs clustering. (B) Secondary structure assignments for JMR (on the left) and A-loop (on the right) were averaged over the two 50-ns MD simulations of CSF-1RWT and CSF-1RMU. For each residue, the proportion of every secondary structure type is given as a percentage of the total simulation time. Each secondary structure type is shown with lines of different colors: 310 helices (in cyan), parallel β-sheet (in red), turn (in orange), bend (in blue) and bridge (green). Coiled structure is sown by dashed lines. The D802V position is indicated as a red circle.

