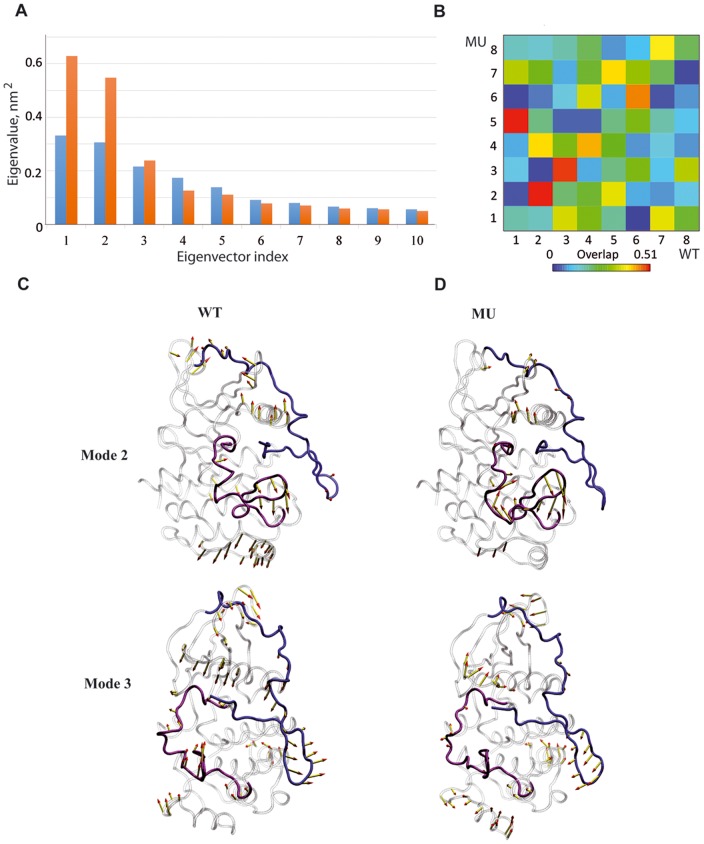
Figure 4. Principal component analysis (PCA) of CSF-1R cytoplasmic region in the inactive state.
The calculation was performed on the backbone atoms of CSF-1RWTand CSF-1RMU. Top: (A) The barplot gives the eigenvalues spectra of CSF-1RWT(blue) and CSF-1RMU (orange) in descending order. (B) The grid gives the overlap between the first 10 eigenvectors from CSF-1RWT (columns) and CSF-1RMU (rows). The overlap between two eigenvectors is evaluated as their scalar product and represented by a colored rectangles, from blue (0) through green and yellow to red (0.51). Bottom: Modes 2 and 3 atomic components for CSF-1RWT (C) and CSF-1RMU (D) are drawn as yellow arrows on the protein cartoon representation. JMR is in blue, A-loop is in violet and the rest of protein is in grey.

