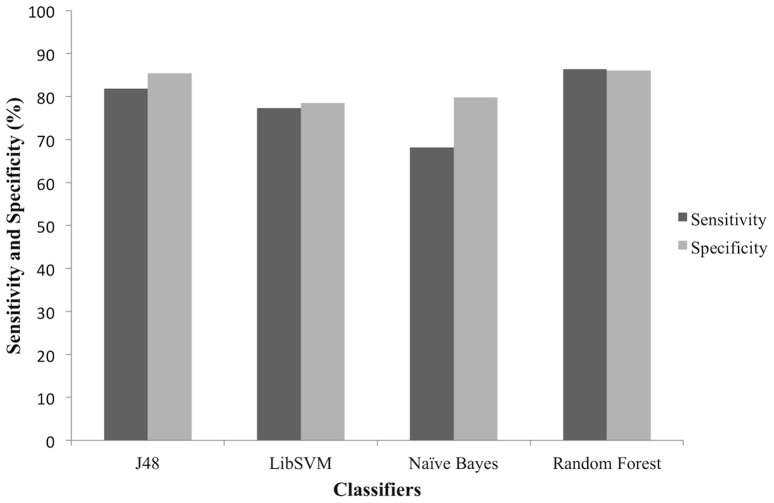
Figure 3. Sensitivity and Specificity plot.
The plot compares sensitivity and specificity of the developed predictive models, to determine effective classifier for identifying positive and negative instances. Random Forest classifier has the highest sensitivity and specificity values as compared to J48, LibSVM and Naïve Bayes.

