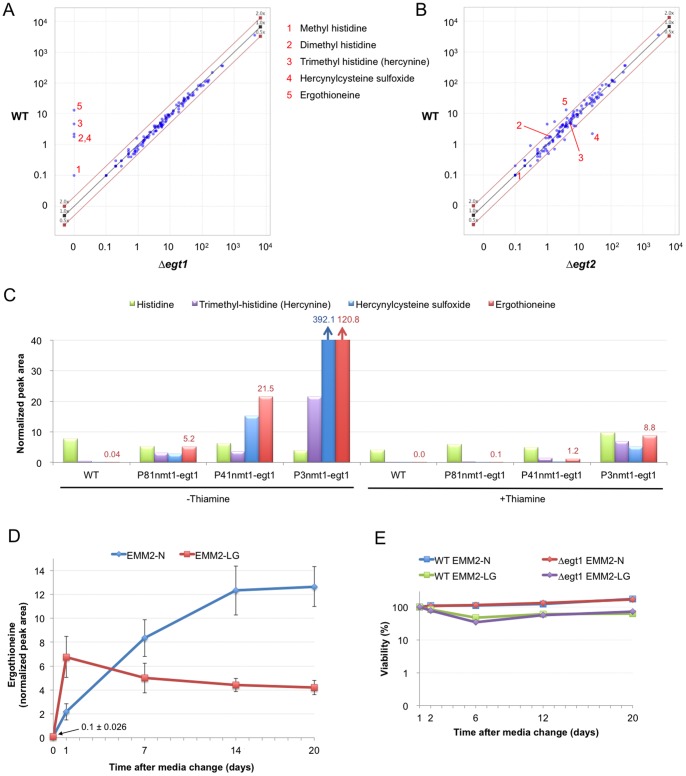
Figure 2. Characterization of Δegt1 and Δegt2 strains.
A and B. A scatter plot comparing results of metabolomic analysis of WT vs. Δegt1 (A) or Δegt2 (B) strains under nitrogen starvation (24 h in EMM2-N medium). Each dot represents a single identified metabolite. Values on both scales indicate normalized peak areas of metabolite peaks in corresponding strains. Red diagonal lines indicate a 2-fold difference. C. Results of metabolomic analysis of WT and egt1+ overexpression strains. Cells were cultivated at 26°C in the EMM2 medium lacking thiamine for at least 24 h. Cultures indicated +Thiamine were cultivated in the presence of 5 µg/ml thiamine for 24 h. Normalized peak areas of compounds composing the EGT pathway are shown. D. Time course metabolomic analysis of quiescent S. pombe cultures under nitrogen (EMM2-N) and glucose (EMM2-LG) starvation. Values represent means ± standard deviations of normalized peak areas of EGT in three independent cell cultures. E. Time course viability results of WT and Δegt1 deletion mutant cultures under nitrogen (EMM2-N) and glucose (EMM2-LG) starvation.

