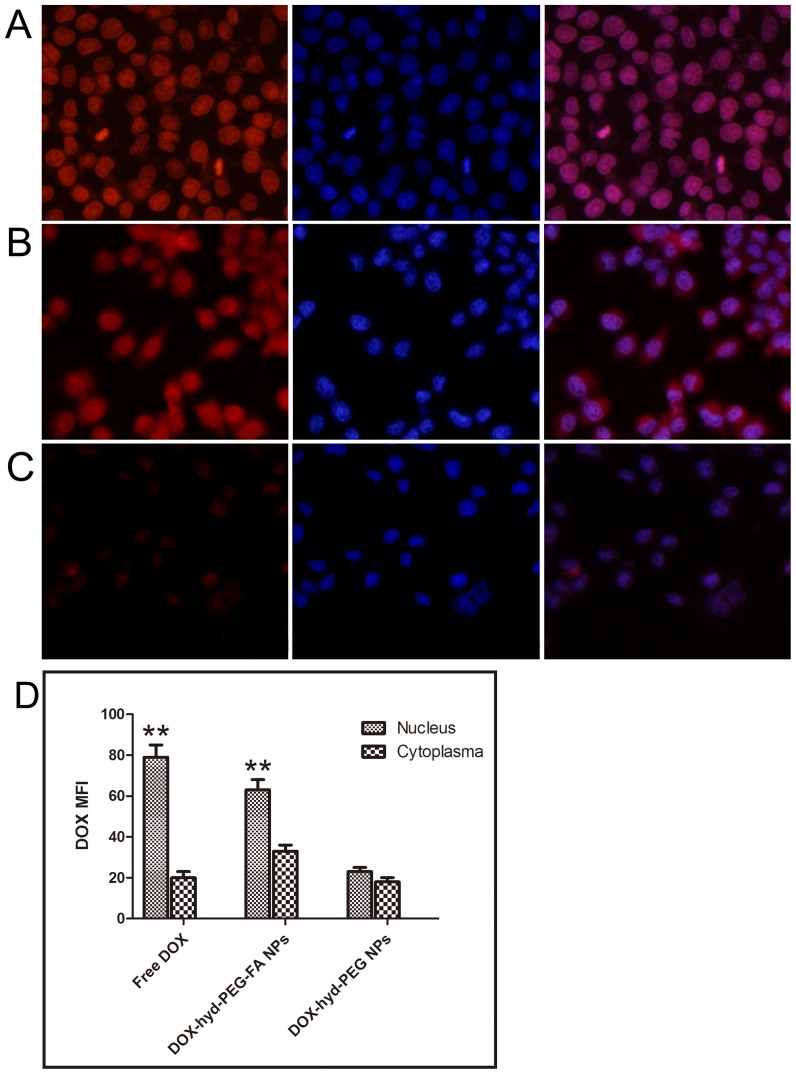
Figure 8. Confocal laser scaning microscopy (CLSM) images of KB cells incubated with DOX (panel A), DOX-hyd-PEG-FA NPs (panel B) and DOX-hyd-PEG NPs (panel C) at 37°C for 4 h. DOX concentration was 10 µg/mL.
The pink region shows the localization of DOX (red) in the nucleus (blue). DOX mean fluorescence intensity (MFI) in the nucleus and cytoplasm of the KB cells are shown in panel D. **P<0.01 vs cytoplasma with the same treatment, n = 5.

