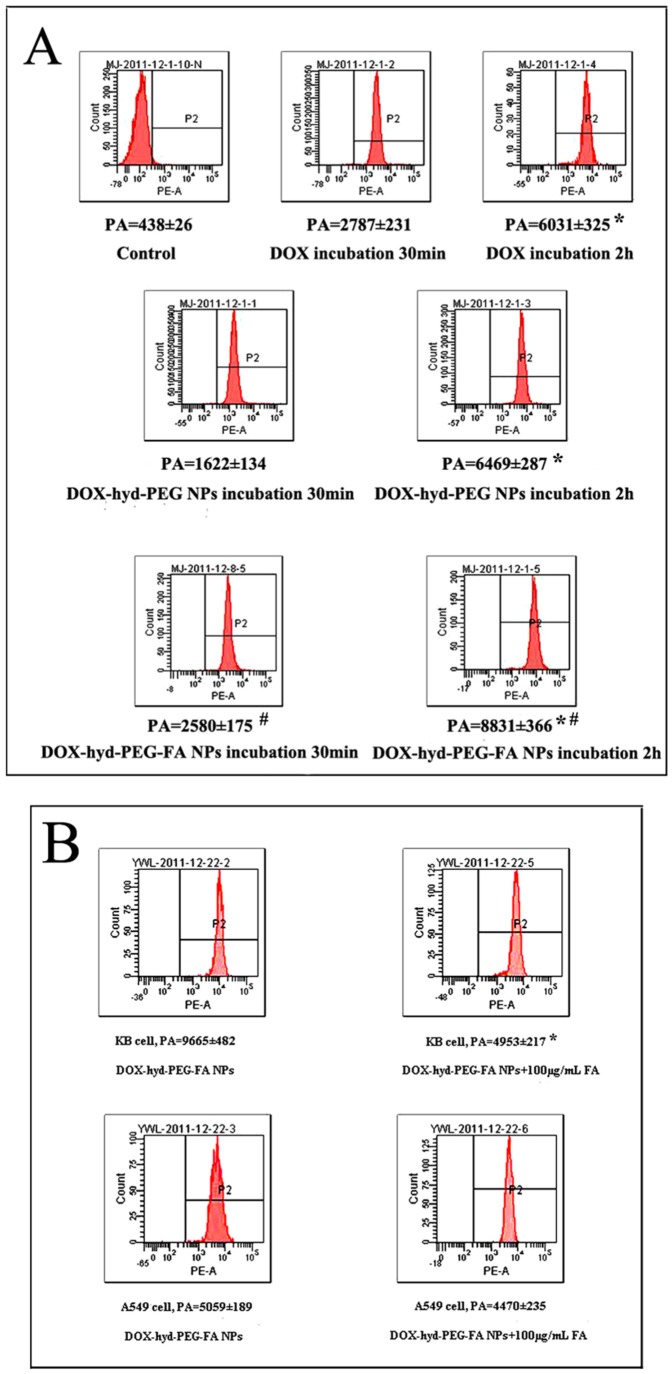
Figure 10. Panel A-Flow cytometry results of KB cells that were incubated with DOX,DOX-hyd-PEG NPs and DOX-hyd-PEG-FA NPs for 30 min and 2 h.
DOX concentration was 10 µg/mL. PA-peak area. *p<0.05 vs same treatment at 30 min; #p<0.05 vs DOX-hyd-PEG NPs at the same time point, n = 5. Panel B-Flow cytometric analysis of KB cells and A549 cells treated with DOX-hyd-PEG-FA NPs when exogenous folate was absent and present in the culture medium. DOX concentration was 10 µg/mL.Incubation time was 2 h. PA-peak area. *p<0.05 vs DOX-hyd-PEG-FA NPs on KB cells, n = 5.

