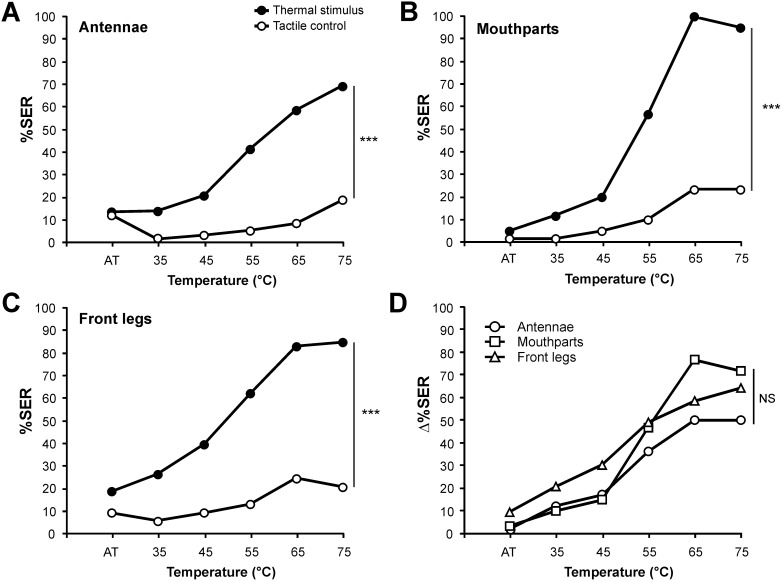
Figure 2. Thermal responsiveness of bees when stimulated on different structures with increasing temperatures.
A–C) Percentage of SER to increasing temperatures (black dots, AT: ambient temperature ∼25°C, 35°C, 45°C, 55°C, 65°C, 75°C) alternating with tactile controls (white dots). Stimulations were applied on: A) the antennae (n = 58); B) the mouthparts (n = 60); C) the front legs (n = 53). On all three structures, bees respond differently to the thermal stimulus than to the tactile control, as a response increase is observed only with the thermal stimulus (repeated measure ANOVA, stimulus x trial effect, ***: p<0.001). D) Delta values (ΔSER%) resulting from the difference between the responses to the thermal and to the tactile stimuli for the three tested structures. No difference appeared in the evolution of the three curves with increasing temperature (repeated measure ANOVA, stimulus x trial interaction: NS).

