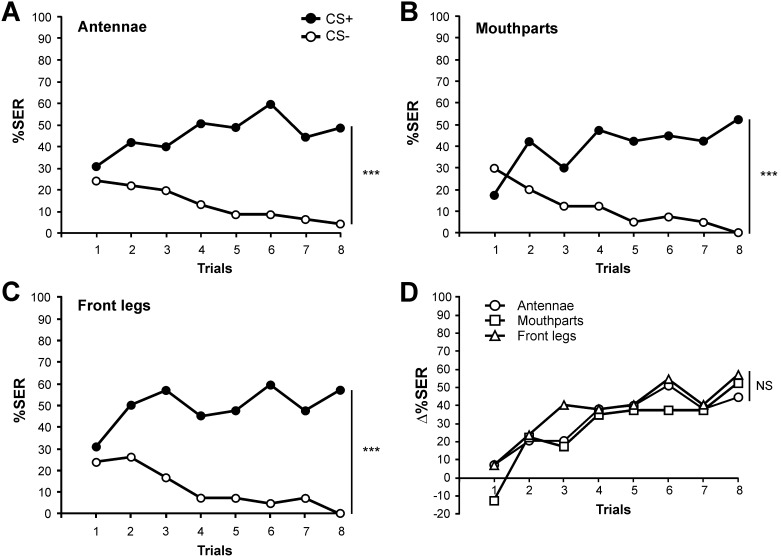
Figure 3. Thermal aversive conditioning with the US applied on different structures.
A–C) Percentage of SER to the reinforced odorant (CS+, black dots) and to the non-reinforced odorant (CS−, white dots) along conditioning trials. The thermal unconditioned stimulus (65°C) was applied on: A) the antennae (n = 45); B) the mouthparts (n = 40); C) the front legs (n = 42). Bees learn to respond to the CS+ and not to the CS− when the thermal stimulus is provided on any of the three structures (repeated measurement ANOVA, stimulus x trial interaction: ***: p<0.001). D) Delta values (Δ%SER) resulting from the difference between the responses to the CS+ and to the CS− for the US applied on the three tested structures. No difference appeared in the evolution of the three curves along conditioning trials (repeated measure ANOVA, stimulus x trial interaction: NS).

