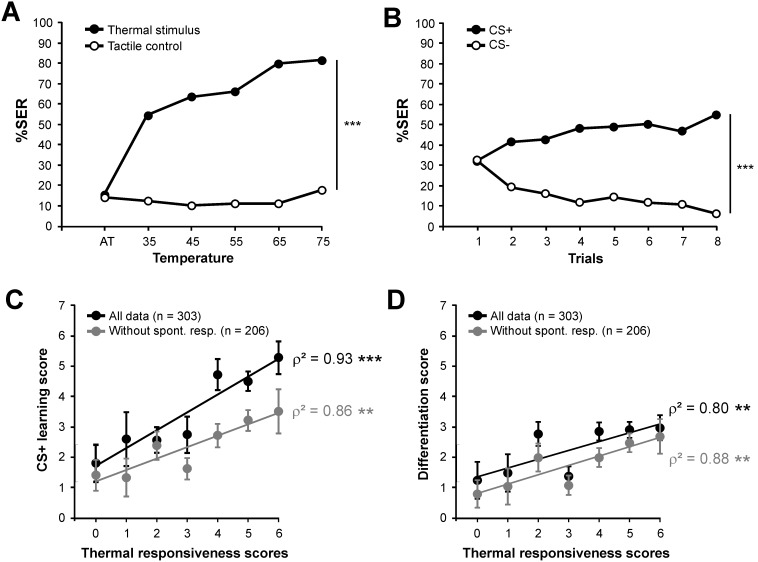
Figure 4. Measure of thermal responsiveness and aversive learning performance on the same bees.
A) Thermal responsiveness curve with the temperature stimulus provided on the mouthparts (n = 303). Percentage of SER with increasing temperatures (black dots) or with tactile control (white dots). The curves for thermal and tactile stimuli develop differently (repeated measure ANOVA, stimulus x trial effect, ***: p<0.001). B) Aversive learning performances with thermal reinforcement on the mouthparts (n = 303). Percentages of SER to the CS+ (black dots) and to the CS− (white dots). Bees learned to respond to the CS+ and not to the CS− (repeated measure ANOVA, stimulus x trial effect, ***: p<0.001). C) Relationship between thermal responsiveness and aversive learning performance. The graph shows average response to the CS+ (± SEM) for bees with different thermal responsiveness scores (n = 17–81 per score). A significant linear relationship between the two variables is found, both using all data (black dots) or only those from bees that did not respond spontaneously to the CS+ (grey dots) (Spearman correlation, ***: p<0.001; **: p<0.01; 8 df). D) Relationship between thermal responsiveness and differentiation performance in the differential conditioning. The graph shows average delta values (responses to the CS+ minus responses to the CS−) ± SEM for bees with different thermal responsiveness scores (n per score as in C). A significant linear relationship between the two variables is found, both using all data (black dots or only those from bees that did not respond spontaneously to the CS+ (grey dots) (Spearman correlation, **: p<0.01; 8 df).

