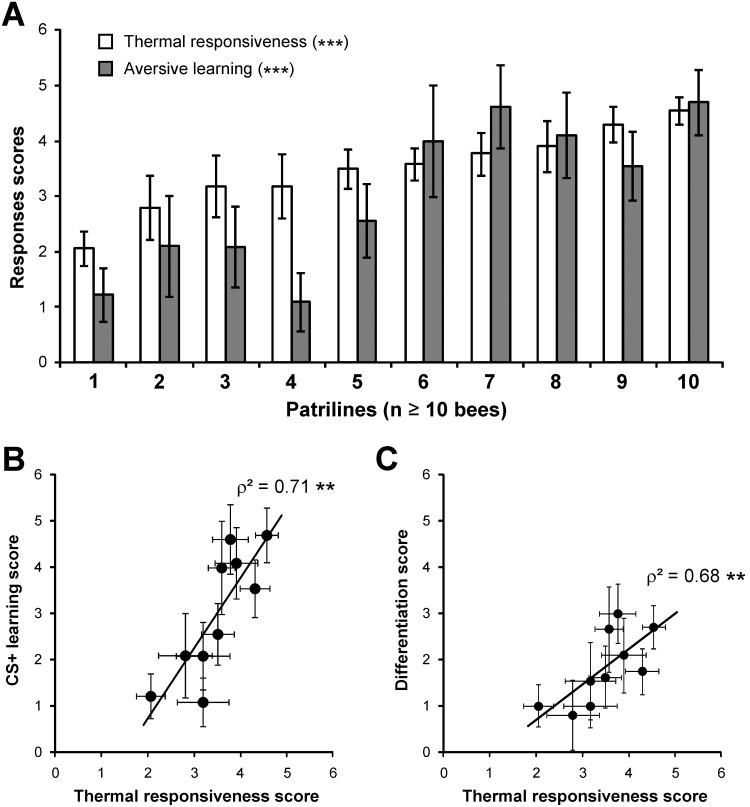
Figure 5. Genotypic influence on thermal responsiveness and aversive learning (patriline effect).
A) Thermal responsiveness (white bar, average ± SEM) and aversive learning scores (grey bar, average ± SEM) for the 10 patrilines with the most samples (n = 10–27 bees per patriline). Patrilines are ranked according to increasing thermal responsiveness scores. Significant differences among patrilines are observed for both scores (one way ANOVA, p<0.001). B) A strong correlation appears between thermal responsiveness and aversive learning performances at the patriline level (Spearman correlation, **: p<0.01, 8df). C) Likewise, a significant correlation appears at the patriline level between the differentiation score (difference between responses to the CS+ and to the CS−) and the thermal responsiveness score (Spearman correlation, **: p<0.01, 8 df).

