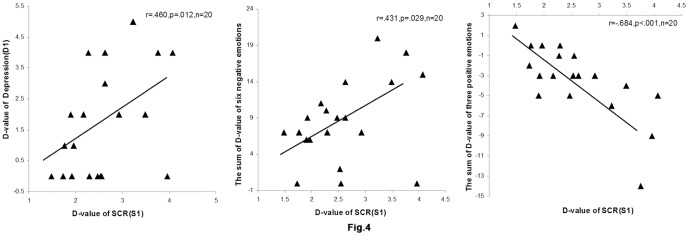
Figure 4. Scatterplots for the three correlations in the control group: between SCR (S1) and the state depression (D1); between SCR (S1) and the sum of the task-rest difference scores for the six negative emotion measures (depressive, upset, irritable, guilty, ashamed, and distressed) that were induced by the frustration task; and between the SCR (S1) and the sum of the task-rest difference scores for the three positive emotion measures (proud, strong, and enthusiastic) that significantly decreased during the frustration task.