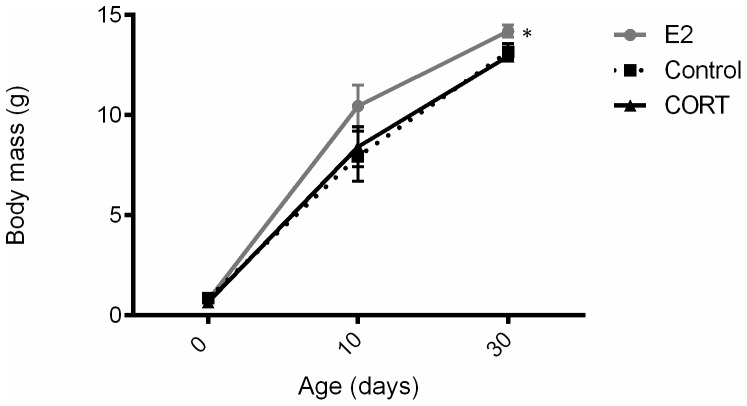
Figure 1. Body mass dynamics of male chicks raised by hormonally-treated (E2 and CORT) and control zebra finch females.
This higher body mass in E2 male chicks results from a significantly higher body mass gain over the first 30(see text for details). Chicks were measured at hatching and every two days until 30 days of age. Grey dots, black squares and black triangles represent E2, Control and CORT treated chicks, respectively. Means are plotted ± SE and * indicates a significant difference in body mass.

