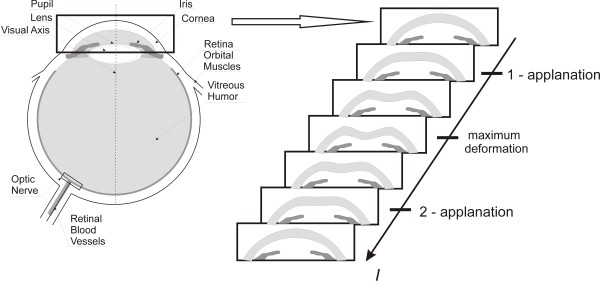
Figure 1.

Schematic diagram showing methodology of the measurement method and corneal response. The cornea is subjected to an air-puff stimulus in the Corvis tonometer. In consequence, an image of the corneal deflection in the line arranged on the main axis is created every 23 μs. Individual deflection phases of greater importance are shown on the right.
