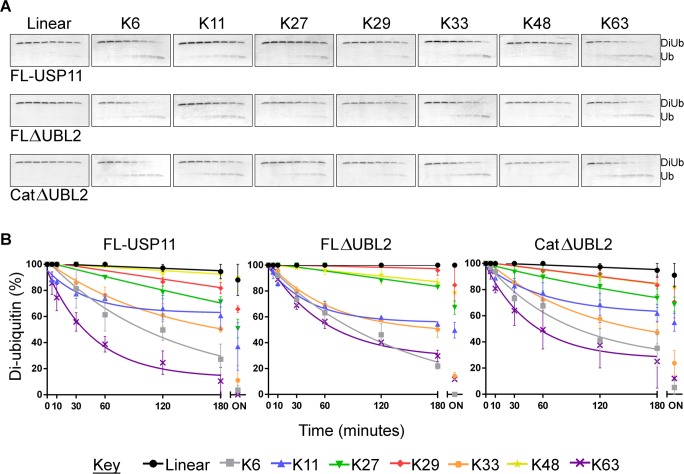
Figure 5.
Ubiquitin chain selectivity. (A) SDS-PAGE analyses of cleavage of diubiquitin to monoubiquitin by USP11 and deletion mutants with the eight linkage types (as labeled). Assays were performed in duplicate and representative gels are shown. The lanes on each gel show a time course of a reaction with 75 nM USP11 and 5 μM substrate at 0, 5, 10, 30, 60, 120, and 180 min with a final overnight sample taken after 19 h. (B) Densitometric analysis of gels. XY scatter plots with diubiquitin percentage plotted against time in minutes for each of the three hUSP11 constructs (as labeled) with each of the eight diubiquitin linkage types (colors indicated in key). Diubiquitin percentage was calculated from ImageJ analyses of SDS-PAGE gels by quantifying the amount of diubiquitin and monoubiquitin in each lane. The mean was calculated from the duplicate assays, and nonlinear regression analyses were performed on time points 0–180 min. Errors are given as standard error mean. ON: overnight sample (not included in nonlinear regression analyses).

