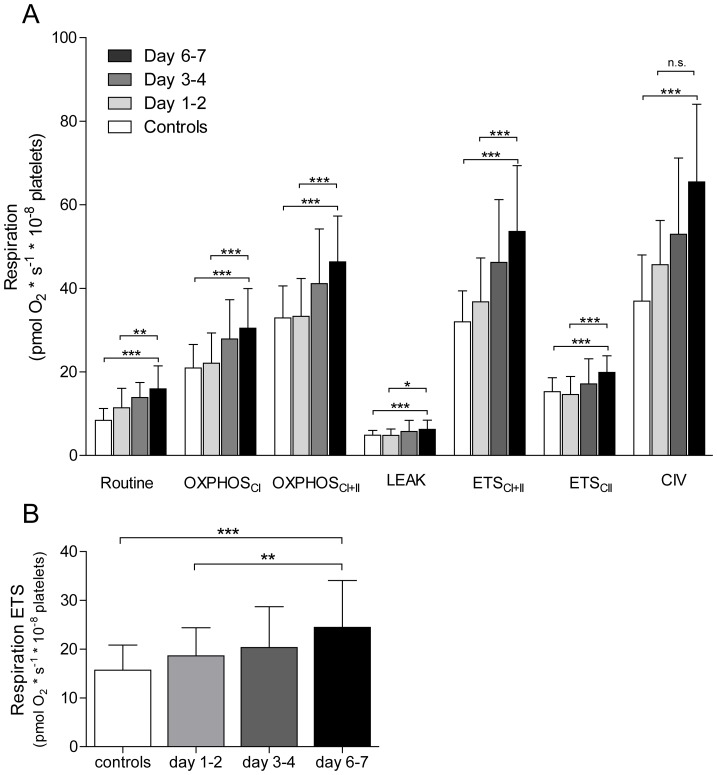
Figure 1. Mitochondrial respiration.
Different respiratory states in controls and at three time points over one week in patients with sepsis in permeabilised (A) and intact cells incubated in their own plasma (B). Controls n = 38, patients n, 1st time point = 38, 2nd time point = 31, 3rd time point = 27. Displayed as mean ± SD. * = p<0.05, ** = p<0.01, *** = p<0.001.

