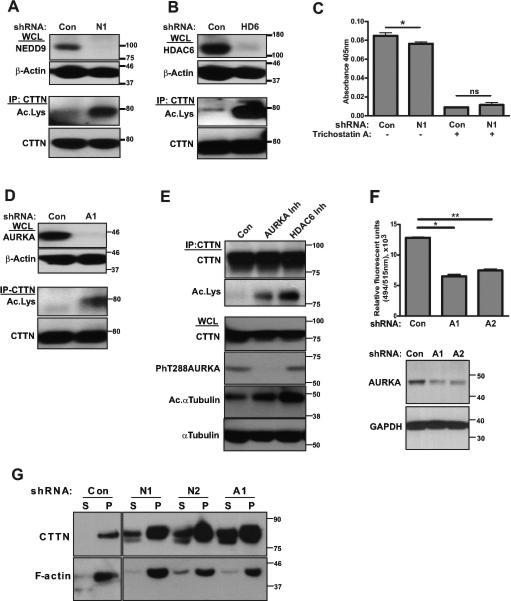
Figure 4. NEDD9 and AURKA deficiency leads to a decrease in HDAC6 activity and an increase in the acetylation of CTTN.

A. Top: Representative images of WB analysis of WCL for NEDD9 expression with anti-NEDD9 and -beta actin antibodies. Bottom: IP, WB analysis of total and acetylated CTTN using anti-CTTN and -acetylated lysine antibodies. B. Top: Representative images of WB analysis of HDAC6 (HD6) with anti-HDAC6 and -beta actin antibodies. Bottom: IP, WB analysis of total and acetylated CTTN with anti-CTTN and -acetylated lysine antibodies. C. Colorimetric HDAC activity assay with cytoplasmic extracts from shCon and shNEDD9 (N1) MDA-MB-231 cells with (+) or without (−) Trichostatin A. Graphs represent mean values ± S.E.M. from three independent experiments, n=3 per treatment group. One-way ANOVA with pairwise comparison *p=0.045 for shCon/shN1 (−) Trichostatin A, and ns for shCon/shN1 (+) Trichostatin A. D. Top: Representative images of WB analysis of AURKA expression with anti-AURKA and -beta actin antibodies. Bottom: IP, WB analysis of total and acetylated CTTN using anti-CTTN and -acetylated lysine antibodies. E. Top: IP of CTTN from lysates of MDA-MB-231 cells pretreated for 12h with: 1) Control 2) AURKA inhibitor, 3) HDAC6 inhibitor, and visualized by anti-CTTN and anti-acetylated lysine antibodies. Bottom: WB analysis of WCL, used for IP (top), with anti-CTTN, -phT288AURKA, -acetylated and -total alpha tubulin. F. Top: Fluoroblock Boyden Chamber migration assay for shCon and shAURKA (shA1, shA2) MDA-MB-231 cells. Data presented as mean values with ± S.E.M from three independent experiments, n=3 per treatment group. One-way ANOVA *p<0.0001 for shCon/shA1; **p<0.0001 for shCon/shA2. Bottom: WB analysis of cells used in migration assay with anti-AURKA and -GAPDH antibodies. G. F-actin pull-down assay using cell lysates shCon, shNEDD9 (N1, N2) and shAURKA (A1) as in (A, D). Representative images of WB analysis of F-actin precipitates (P) and supernatant (S) with anti-CTTN and -actin antibodies.
