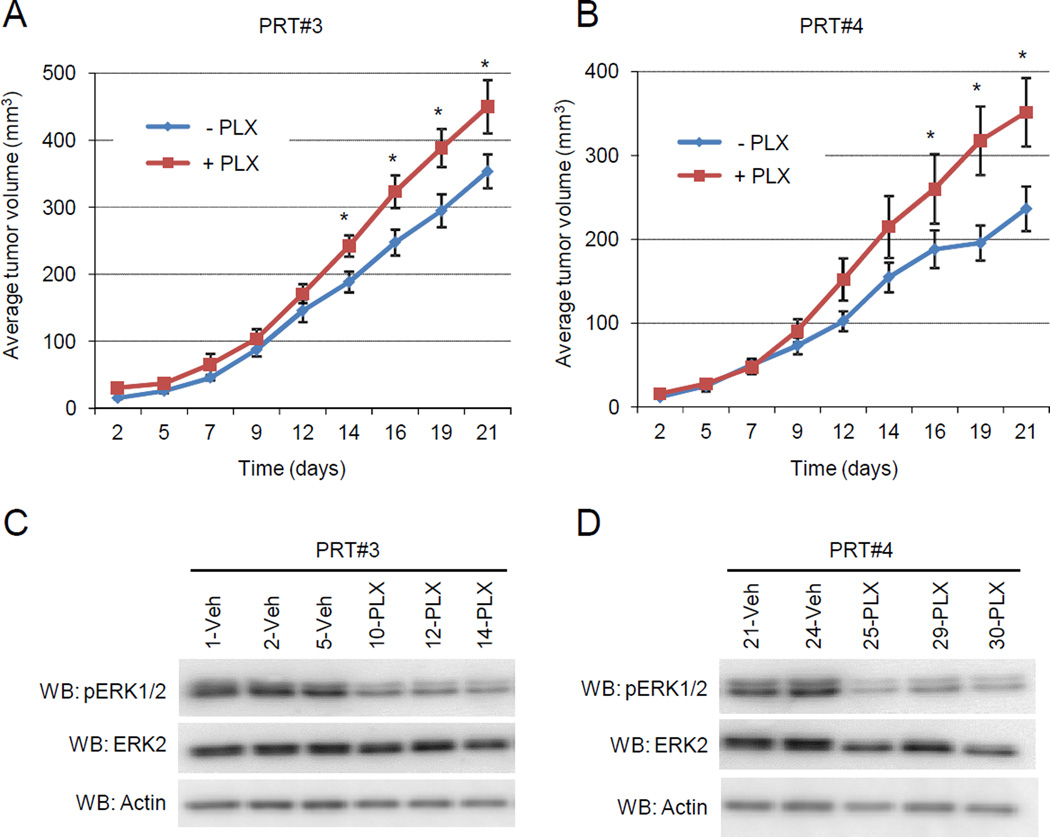
Fig. 2. Accelerated growth of PRT #3 and PRT #4 in vivo with RAF inhibitor treatment.
(A,B) Intradermal injections of 1.0 x10⁶ cells on the back of 7 week old female Nu/J mice was performed with PRT #3 and PRT #4 (16 mice for each cell line). 8 mice from each of the cell lines were then randomly chosen to be fed chow laced with 417mg/kg PLX4720 or vehicle chow. Tumor measurements with digital calipers were taken over a 21 day time course. Graphs are depicting mean tumor growth in mm3 for PRT #3 (A) and PRT #4 (B). An asterisk (*) on the indicated day represents a p value < 0.05. The error bars represent +/− SEM. (C) PRT #3 xenografts were harvested and single cell suspensions were generated for in vitro testing. Tumor cells arising from the indicated mouse number were treated with either DMSO or 1µM PLX4720 in an attempt to maintain in vivo conditions. Once sufficient cell numbers were obtained (approximately 3 days), they were seeded with or without 1µM PLX4720 and lysed for western blot analysis. (D) As for (C), except PRT #4 xenografts were analyzed.

