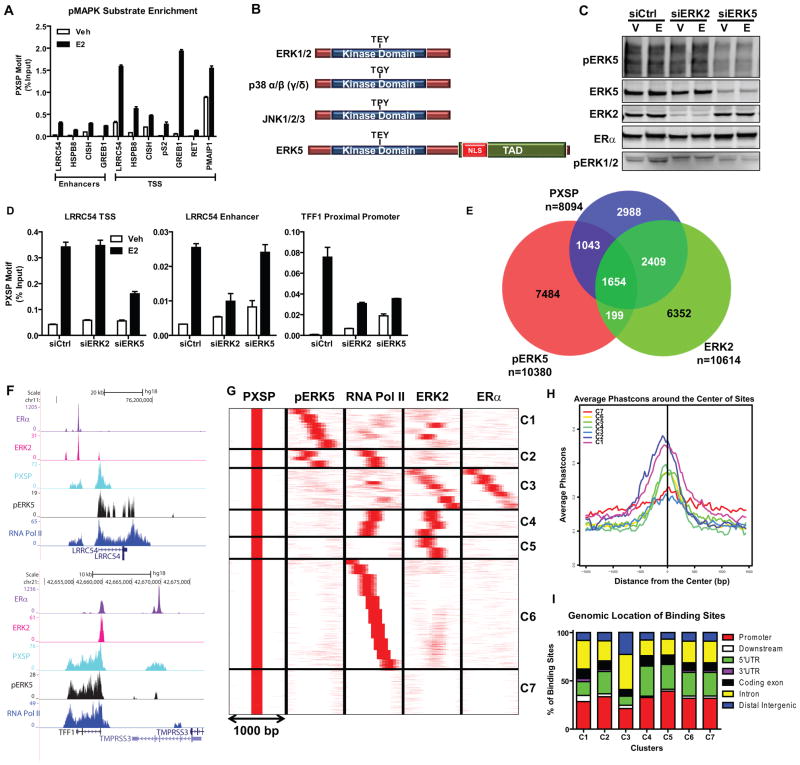
Figure 1. ERK5 is a novel kinase recruited to the transcription start site (TSS) of hormone-activated ERα-regulated genes.
(a) ChIP-qPCR of pMAPK substrates recruitment to regulatory regions of various E2-regulated genes in MCF-7 cells. Cells were treated with vehicle or 10 nM E2 for 45 min. After cross-linking, pMAPK substrates/DNA complexes were immunoprecipitated. Immunoprecipitated DNA levels were measured by qPCR and % input calculated. Results (mean ± SD) are from three independent experiments.
(b) Domains of typical MAPK family members. NLS, nuclear localization sequence. TAD, transcription activation domain.
(c) Validation of selective ERK2 or ERK5 knockdowns. Cells were transfected with siCtrl, siERK2, or siERK5 for 72h. Protein levels were verified by Western blotting.
(d) pMAPK substrates recruitment and impact of knockdown of ERK2 or pERK5 on recruitment to gene regulatory regions. Chromatin was prepared from cells transfected with siCtrl, siERK2 or siERK5 for 72h and then treated with Veh or E2 for 45 min. DNA/Protein complexes were immunoprecipitated and levels were measured by qPCR and % input calculated. Results (mean ± SD) are from two independent experiments.
(e) Venn diagram depicting overlapping pMAPK substrates, ERK2 and pERK5 cistromes after MCF-7 treatment with E2.
(f) Track view of ERα, ERK2, pMAPK substrates, pERK5 and RNA Pol II ChIP-seq density profiles after E2 treatment shown using the UCSC genome browser centered on the LRRC54 and TFF1 genes. Cells were treated with E2 for 45 min and protein/DNA complexes were immunoprecipitated and ChIP-sequencing performed. Sequences were mapped uniquely onto the human genome (hg18). MACS algorithm was used to identify enriched peak regions (default settings) with p-value cutoff of 6.0e-7 and FDR of 0.01.
(g) Cluster analysis of ChIP-Seq data for pMAPK substrates (PXSP), pERK5, RNA Pol II, ERK2 and ERα after E2 treatment using SeqMINER software in 1000 bp window; pMAPK substrates cistrome was used as the reference.
(h) Conservancy of binding sites from each cluster identified in Fig. 1g. Conservancy plots were generated with CEAS software using a 3000 bp window.
(i) Location of binding sites in each cluster (C1–C7) relative to annotated genes, determined using CEAS software.

