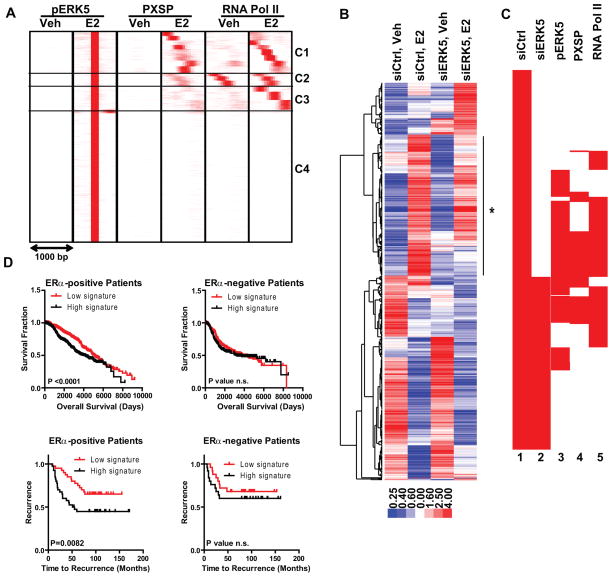
Figure 2. ERK5 binds to and regulates genes required for E2-mediated cell proliferation and predicts clinical outcome in patients with ERα-positive breast cancers.
(a) Cluster analysis of ChIP-Seq data for pERK5, pMAPK substrates, and RNA Pol II after Veh (0.1% EtOH) or 10 nM E2 treatment of MCF-7 cells using SeqMINER software in 1000 bp window and pERK5-E2 cistrome as the reference.
(b) Cluster diagram of genes impacted by ERK5 knockdown. MCF-7 cells were treated with siCtrl or siERK5 for 72h prior to treatment with vehicle or E2 for 24h. Affymetrix gene expression microarrays were analyzed using LIMMA and Tightcluster software. The cluster map is visualized using Treeview Java. Expression level is indicated below. Line with star at right indicates gene cluster associated with reduced E2 stimulation after ERK5 knockdown.
(c) Clustering of chromatin coordinates of the TSS region of E2-regulated genes in siCtrl or siERK5 cells (lanes 1,2) and comparison of chromatin binding sites for pMAPK substrates, pERK5, and RNA Pol II (lanes 3,4,5). Density arrays were generated using Enrichment Based Method option of SeqMINER software. Data were clustered using Cluster3 software and visualized using Java Treeview software.
(d) Survival and time to recurrence analysis using our ERK5 modulated gene list and patient gene expression and survival/recurrence data from (upper panels) Curtis (50) and Wang (51) datasets (lower panels) obtained from the Oncomine database. Data is shown for patients with ERα-positive (left) and ERα-negative (right) breast cancers.

