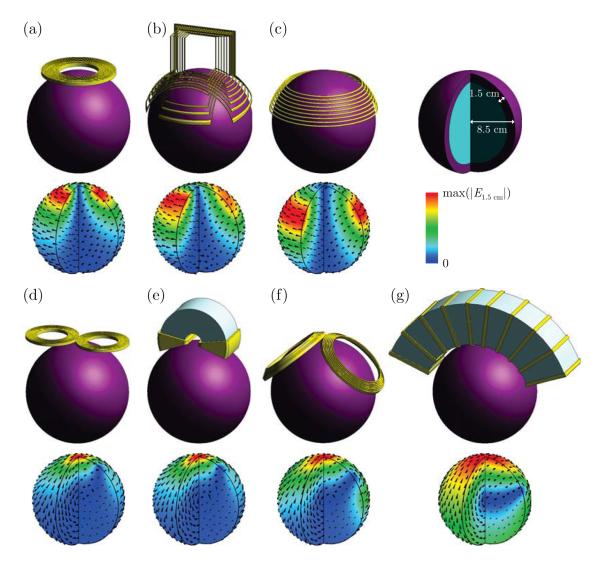
Figure 2.
Simulation models of seven TMS coil configurations and the corresponding electric field distribution in the brain: (a) Magstim 90 mm circular coil, (b) Brainsway H1 coil, (c) crown coil (α = 65°, β = 40°; Figure 1(a)), (d) Magstim 70 mm figure-8 coil, (e) Neuronetics iron core figure-8 coil, (f) Magstim double cone coil, (g) stretched C-core coil (γ = 140°, h = w = 7 cm; Figure 1(b)). A quarter of the brain sphere is removed to visualize the electric field in depth. The electric field magnitude is normalized to the peak electric field on the cortical surface, max(∣E1.5 cm∣).

