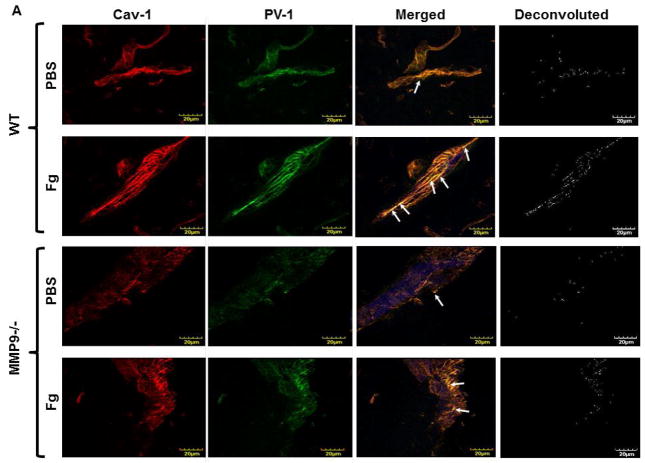
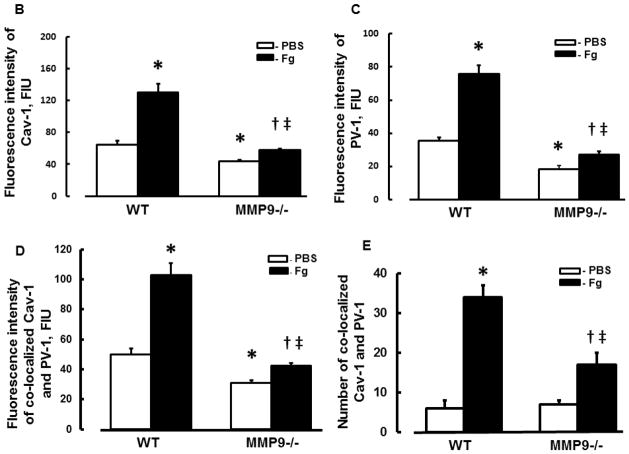
Figure 1. Expression of caveolin-1 (Cav-1) and plasmalemmal vesicle-associated protein-1 (PV-1) in mouse brain cortical vessels.
A) Examples of vessel images in samples obtained from wild type (WT; two upper rows) and MMP-9 gene knockout (MMP9−/−; two lower rows) mice infused with phosphate buffered saline (PBS; first and third rows) or fibrinogen (Fg, final blood content - 4 mg/ml; second and forth rows). Expression of Cav-1 (red, first column) and PV-1 (green, second column) were assessed by measuring the fluorescence intensity of respective fluorochromes along the vascular segments. The third column represents images of co-localized (merged) Cav-1 and PV-1 with Lycopersicon esculentum agglutinin tomato lectin (blue) that was used as an endothelial marker. Images in the fourth column are obtained after deconvolution of images in the third column and show spots of co-localized Cav-1 and PV-1. Summaries of fluorescence intensity changes of Cav-1 (B), PV-1 (C), and their co-localization (D-fluorescence intensity and E-number of spots) in vascular segments after infusion of PBS or Fg.
P < 0.05 for all. * - vs. WT+PBS, † - vs. WT+Fg, ‡ - vs. (MMP9−/−)+PBS. n=4 for all groups.
Note: Data analyses were done on original images. However, for better visualization, brightness of “mask” images (the fourth column) has been increased by 90%.


