
Figure 2. Content of caveolin-1 (Cav-1) and plasmalemmal vesicle-associated protein-1 (PV-1) in mouse brain.
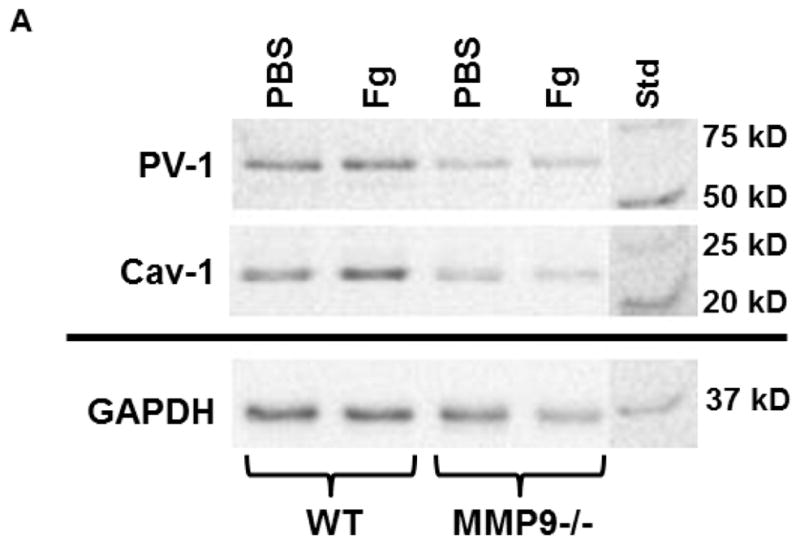
A) A representative Western blot for protein content of Cav-1 and PV-1 in WT and MMP9−/− mice infused with phosphate buffered saline (PBS) or 4 mg/ml fibrinogen (Fg) (top two rows). Membranes were reprobed for GAPDH (bottom row).
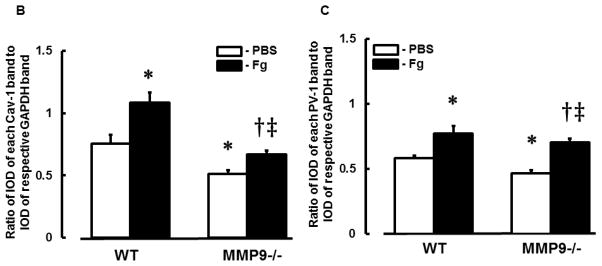
Data analyses for Cav-1 (B) and PV-1 (C) are shown. Relative protein expression in samples is presented as a ratio of integrated optical density (IOD) of each band to the IOD of the respective GAPDH band.
P < 0.05 for all. * - vs. WT+PBS, † - vs. WT+Fg, ‡ - vs. (MMP9−/−)+PBS. n=3 for all groups.