
Figure 3. Phosphorylation of caveolin-1 (pCav-1) in mouse brain cortical vessels.

A) Examples of mouse brain cortical vessel images in samples obtained from wild type (WT; first column) and MMP-9 gene knockout (MMP9−/−; second column) mice infused with phosphate buffered saline (PBS; first row) or fibrinogen (Fg, final blood content - 4 mg/ml; second row). The level of pCav-1 (green) was assessed by measurement of fluorescence intensity along the vascular segment. DAPI-labeled vascular cell nuclei (blue).
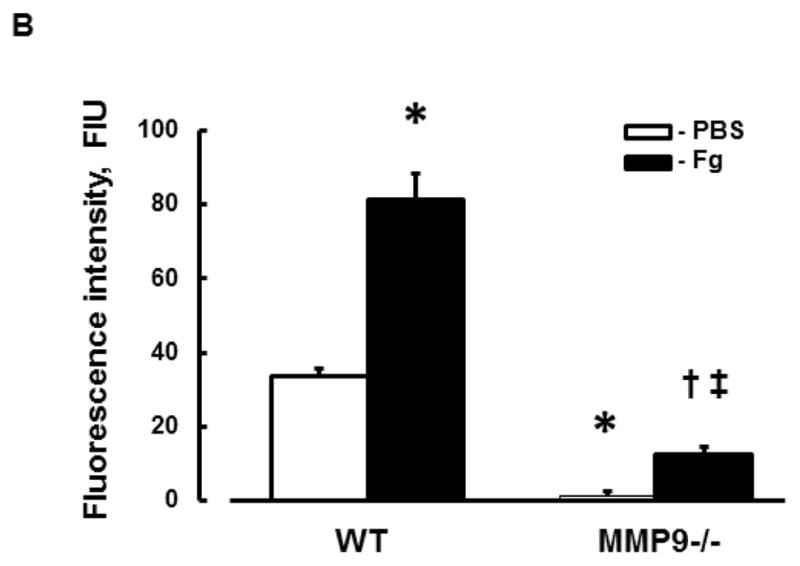
B) Summary of fluorescence intensity changes in vascular segments after infusion of PBS or Fg.
P < 0.05 for all. * - vs. WT+PBS, † - vs. WT+Fg, ‡ - vs. (MMP9−/−)+PBS; n=3 for all groups.