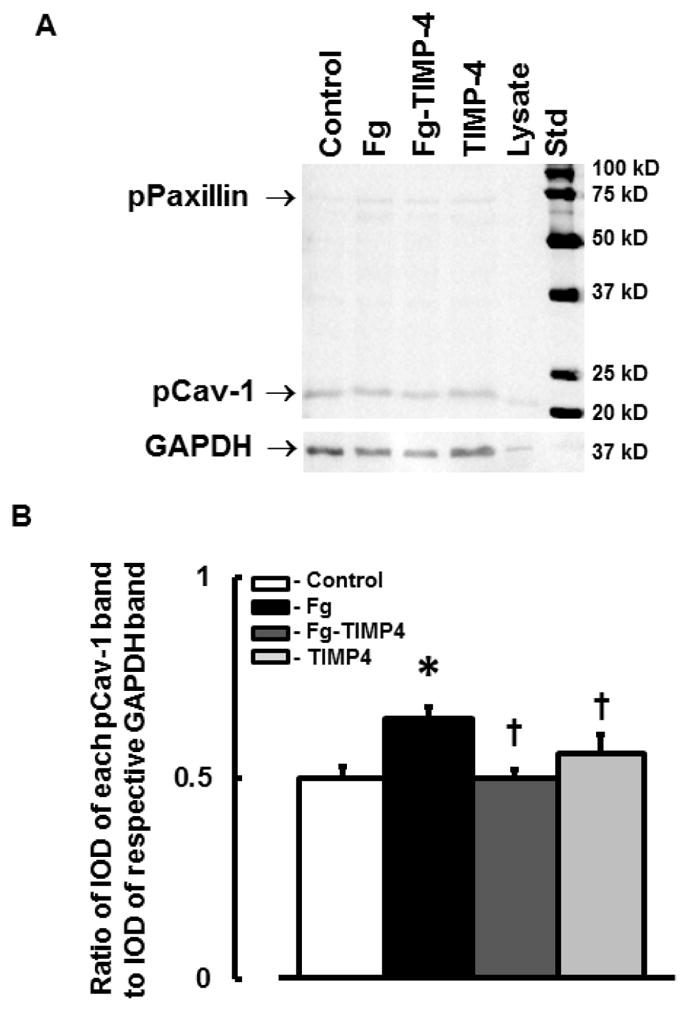
Figure 6. Phosphorylation of Cav-1 (pCav-1) in cultured mouse brain endothelial cells (MBECs).

A) A representative Western blot image for phosphorylation of Cav-1 in MBECs treated with medium alone (control), 4 mg/ml of Fg, 4 mg/ml of Fg in the presence of 12 ng/ml TIMP-4 (Fg-TIMP4), and with 12 ng/ml TIMP-4 alone (TIMP4). Cell lysate (Lysate) was used as a positive control for pCav-1. The membrane was reprobed for GAPDH (bottom row).
B) Data analyses for pCav-1. Relative protein expression in samples is presented as a ratio of integrated optical density (IOD) of each band to the IOD of the respective GAPDH band.
P < 0.05 for all. * - vs. control, † - vs. Fg, n=3 for all groups.
Note: The antibody pY14 used to identify phosphorylated Cav-1 also cross-reacts with phosphorylated paxillin (pPaxillin). Phosphorylation of paxillin was significantly lesser than that of Cav-1. In addition, changes in paxillin phosphorylation correlated with that of Cav-1 (data are not presented).
