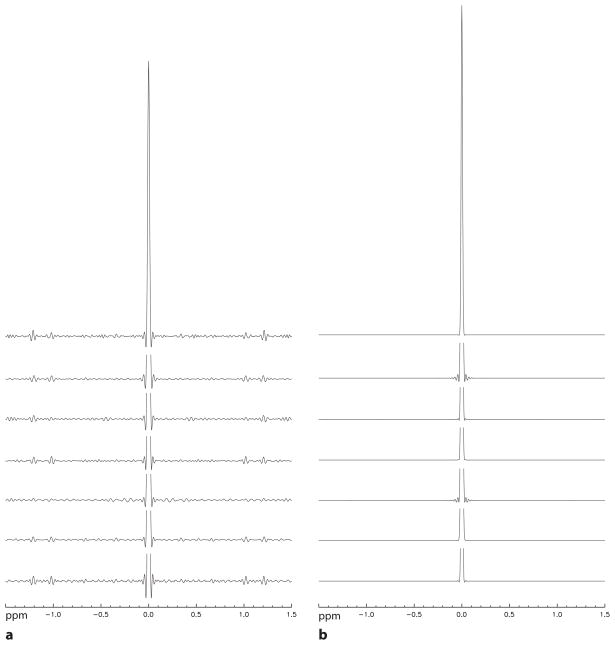
Fig. 7.
Stack plots of signal distortion PSFs for the seven healthy volunteers. a: PSFs for the original Wiener filtering method. b: PSFs for the new Wiener filtering method. Same amount of Gaussian line broadening was used in generating the PSFs for the two different methods, which ranges from 5 – 7 Hz for all subjects. The PSF main peaks are truncated except the two on the top row.

