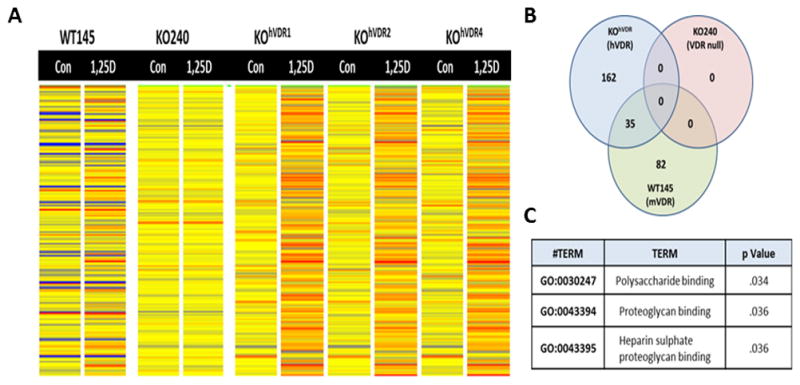
Figure 4. Heat map of 1,25D regulated genomic profiles in murine cells with differential VDR expression.

A, Heat maps of genomic profiles obtained from WT145 cells, KO240 cells and three independently derived KOhVDR clones (# 1, 2, 4) after 24h treatment with ethanol vehicle control (Con) or 100nM 1,25D. Cells were processed for Affymetrix microarray screening and analyzed by Genespring as described in Methods. B, Venn diagram of 1,25D regulated genes identified a cohort of 35 genes that were similarly regulated by 1,25D in both WT145 and KOhVDR cells. C, Pathway analysis of the 35 genes commonly regulated by 1,25D in WT145 and KOhVDR cells.
