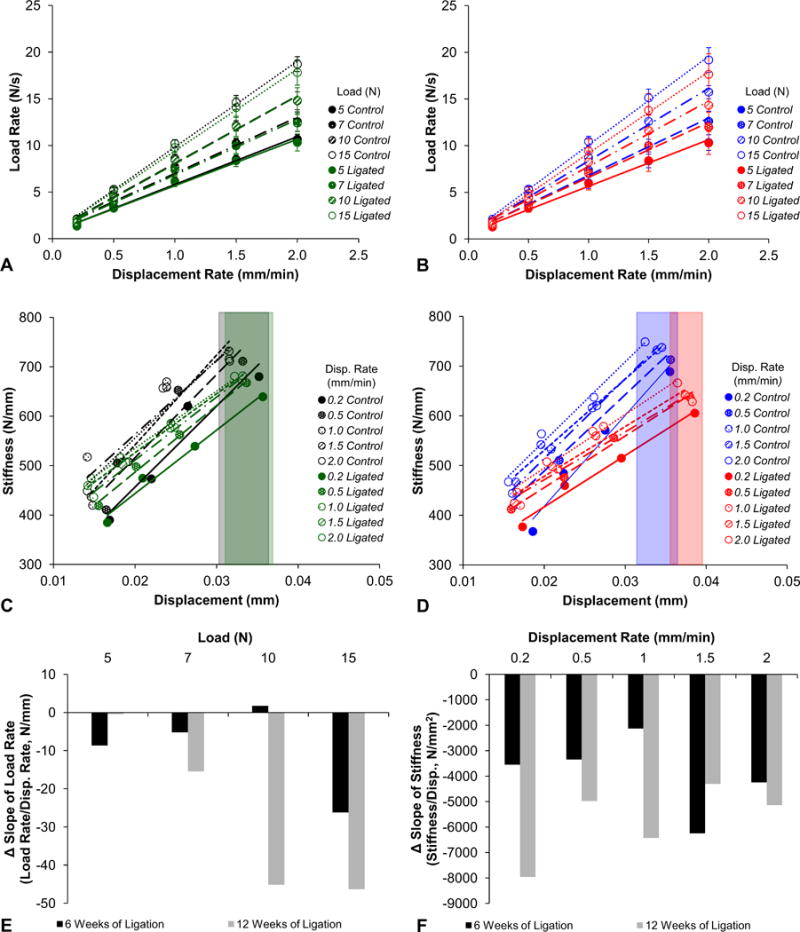
Figure 1. Biomechanical response to simulated cyclical physiological loads.

Load rate versus displacement rate plots compare the reactionary load rate response of fibrous joints after 6 weeks (A; control – black, ligated – green) and 12 weeks (B; control – blue, ligated – red) of ligation. Linear trend lines are fitted through each group of data points from each reactionary peak load using the least squares method. Stiffness versus displacement plots compare the stiffness response of fibrous joints after 6 weeks (C; control – black, ligated – green) and 12 weeks (D; control – blue, ligated – red) of ligation. Trend lines are plotted through each group of data point from each displacement rate. Color-coded boxes highlight the differences in displacement ranges between control and ligated groups. Column plots were used to illustrate the differences in slopes between control and ligated groups (control value subtracted from ligated value) at each time point (6-week – black, 12-week – gray) as measured from load rate-displacement rate (E) and stiffness-displacement (F) graphs. Disp. – displacement.
