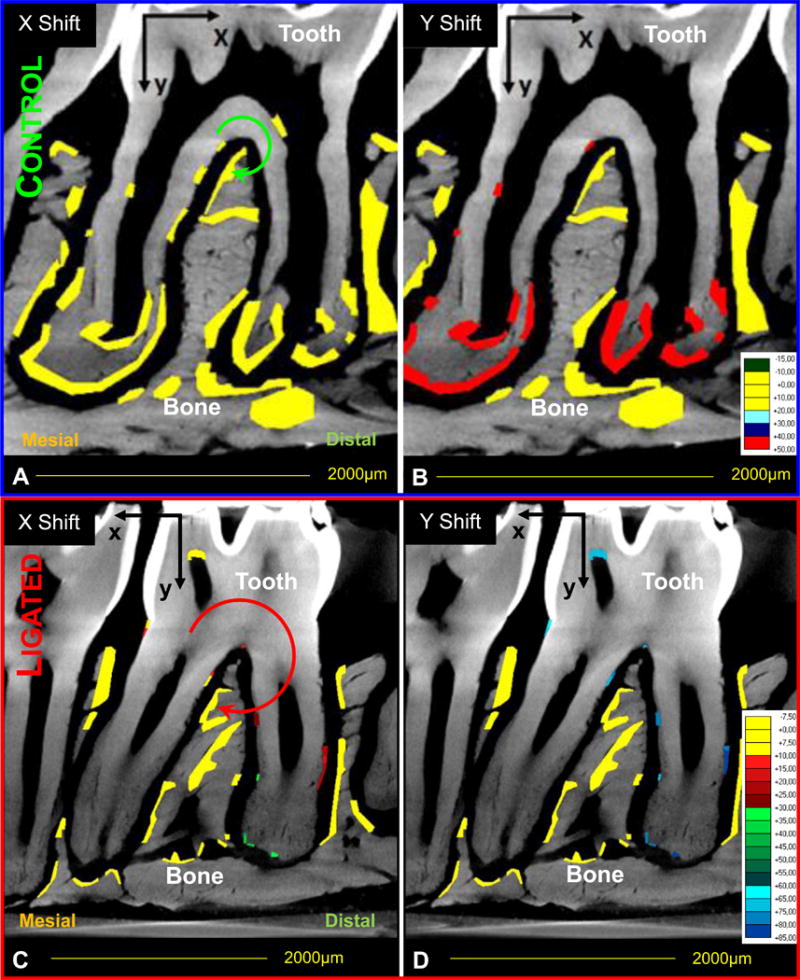
Figure 4. Calculated tooth displacement within the alveolar bone socket using digital image correlation (DIC).

Comparisons in tooth displacement relative to the bone within control (A,B) and ligated (C,D) joints. Color-coded regions indicate areas analyzed for changes in horizontal (X-axis, A, C) and vertical (Y-axis, B, D) displacement fields. Each color represents a different displacement range. Please note the axis and displacement range changes for displacement vectors between control and ligated joints. Circular arrows are representative (not to scale) indicators of the direction and magnitude of tooth movement based on calculated DIC values.
