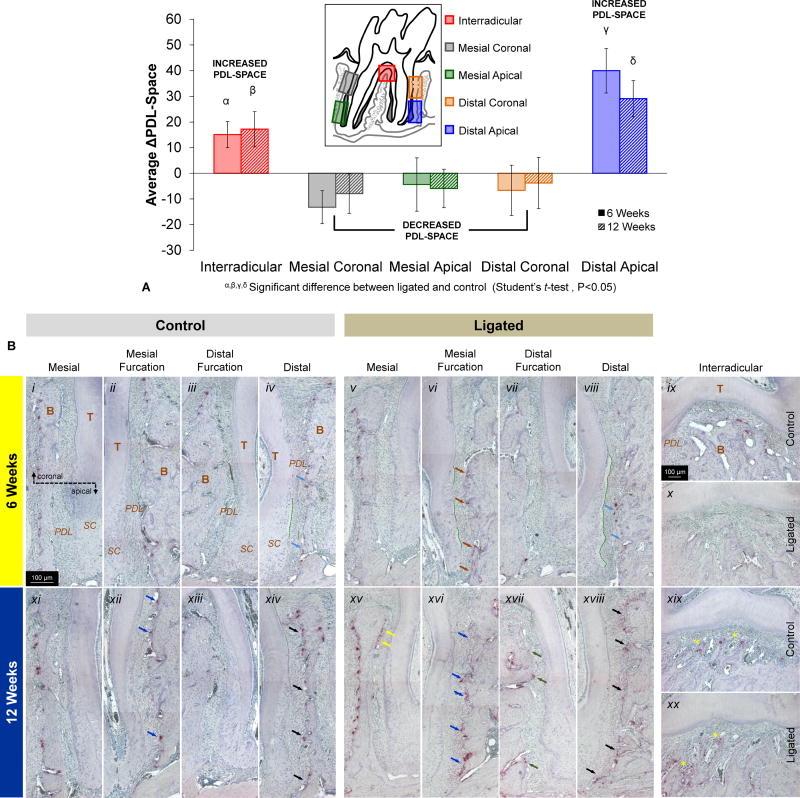
Figure 5. Correlation between morphometrics and osteoclastic activity as analyzed through PDL-width and TRAP staining.
(A) The column graph shows differences in average PDL-space measurements between control and ligated fibrous joints (control values subtracted from ligated values) at interradicular (red), mesial coronal (grey), mesial apical (green), distal coronal (orange), and distal apical (blue) regions. Both 6-week (solid) and 12-week (hashed) time points are plotted. Positive values indicate increased PDL-space in ligated joints compared to controls while negative values indicate decreased PDL-space in ligated joints compared to controls. α, β, γ, δ Significant difference between ligated and control within each region (Student's t-test, P<0.05). (B) Light micrograph images taken at 10× magnification compare localization and intensity of TRAP(+) staining within osteoclasts, reversal lines, and the extracellular matrix of control (i-iv, ix, xi-xiv, xix) and ligated (v-viii, x, xv-viii, xx) joints after 6 weeks (i-x) and 12 weeks (xi-xx) of ligation. At 6 weeks, differences are annotated in distal (light blue arrows) and mesial furcation (brown arrows). At 12 weeks, differences are noted in mesial (yellow arrows), mesial furcation (blue arrows), distal furcation (green arrows), and distal regions (black arrows) are compared. Advancement of secondary cementum is also highlighted (green hashed lines). Please note that tissues within each image were oriented similarly based on corresponding regions of mesial coronal, mesial apical, distal coronal, distal apical, and interradicular. T – tooth; B – bone; PDL – periodontal ligament; SC – secondary cementum.

