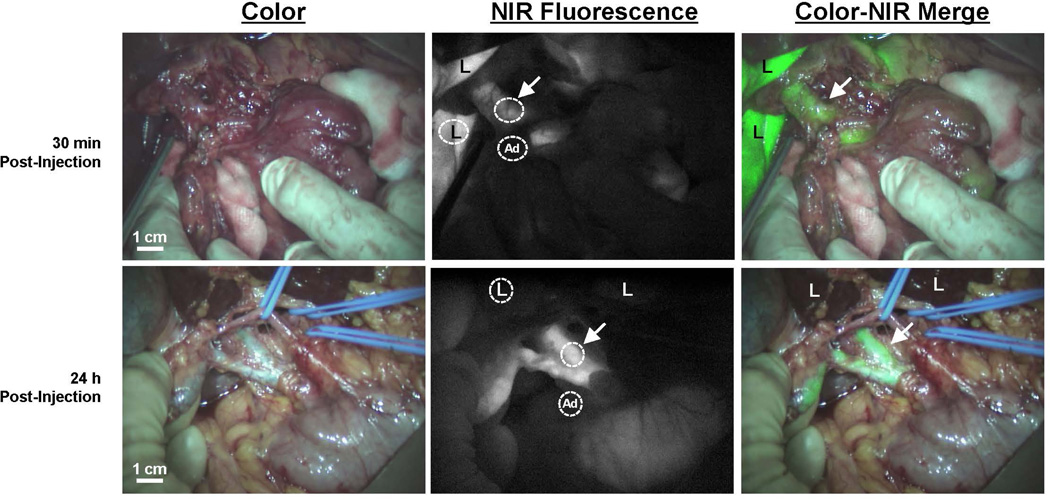
Figure 1. NIR fluorescence imaging of the common bile ducts.
Color video (left panel), NIR fluorescence (middle panel), and a color-NIR overlay (right panel) of intraoperative bile duct imaging. Upper row shows a patient undergoing pancreatoduodenectomy, 30 min after administration of 10 mg ICG. Bottom row shows a patient who underwent liver resection for colorectal metastases, 24 h after administration of 10 mg ICG. Arrows indicate the position of the common bile duct; “L” indicates the position of the liver and “Ad” indicates the localization of adipose tissue surrounding the biliary three. Circles are shown to give an example of the region-of-interests of liver, CBD and surrounding adipose tissue.

