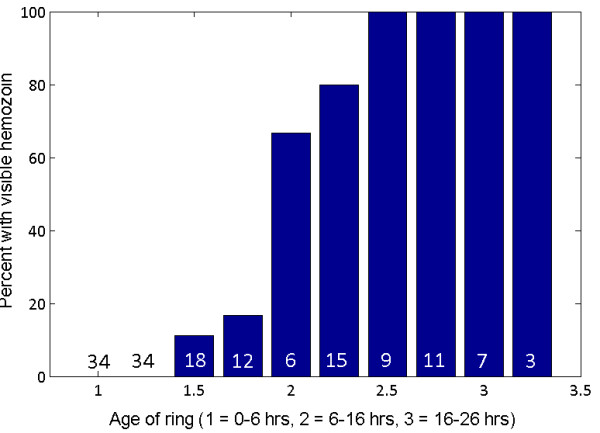
Figure 5.

Percentages of parasites with haemozoin vs age. The percentage of various ages of ring parasites containing sufficient haemozoin signal to be detectable by the adaptive threshold test. The figure in the base of each column is the number of rings of that age in the sample set. On the age (x-) axis, 1 = 0–6 hrs, 2 = 6–16 hrs, 3 = 16–26 hrs. Values between these three integers correspond to split decisions among the observers and reflect edge cases. For example, 1.5 corresponds to the earlier end of 6–16 hrs, while 2.5 corresponds to the later end of 6–16 hrs.
