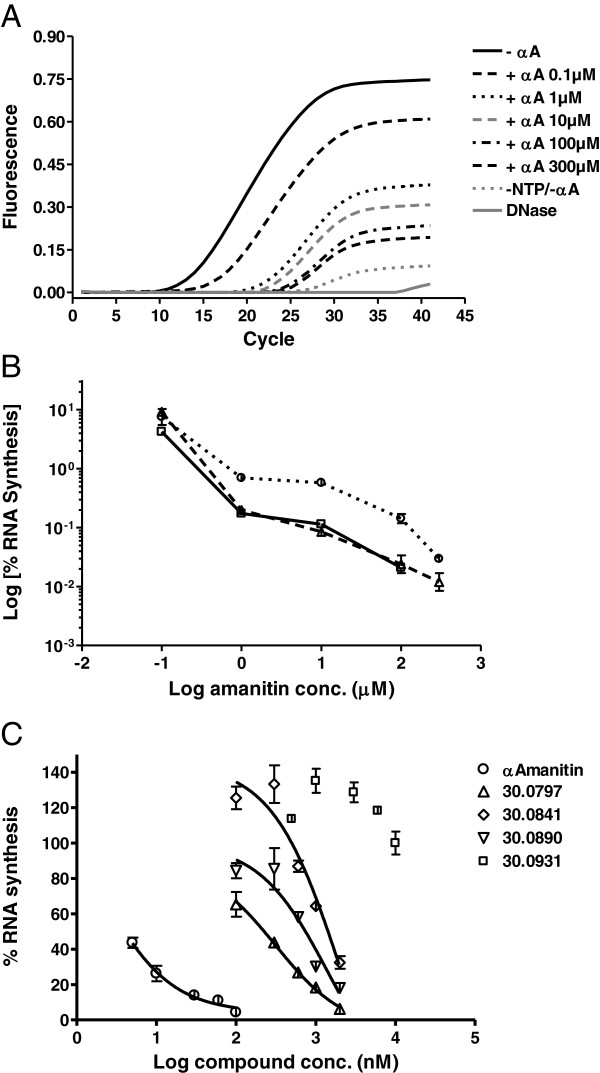
Figure 4.
Quantitative analysis of RNA synthesis by optimized qPCR.In vitro transcription was performed using the linear, bead immobilized DNA template Bead-HS-DNA. Each reaction was performed in duplicate. The RNA was purified, DNase digested and analyzed by reverse transcription followed by qPCR amplification. A. The amplification curves of RNA products derived from uninhibited and α-amanitin-containing reactions showed gradually decreasing C(T) values with increasing α-amanitin concentrations. For each type of reaction, the average fluorescence values were plotted. -αA – transcription reactions without α-amanitin; +αA - transcription reactions in the presence of α-amanitin; −NTP/-αA – negative control transcription reactions. B. Graphic representation of the calculated percent RNA synthesis in the presence of amanitin derived from the qPCR curves presented in A and from two additional similar experiments. Due to the high amanitin concentrations used, the residual percent RNA synthesis was lower than 10% and is depicted in a logarithmic scale. C. The optimized method was used to compare the inhibitory activity of amanitin to that of four synthetic analogs. B &C. The newly synthesized RNA amount was calculated using a DNA standard curve. By relating to the RNA amount synthesized in the uninhibited reactions a residual percent RNA synthesis was calculated. Bars show standard deviation.

