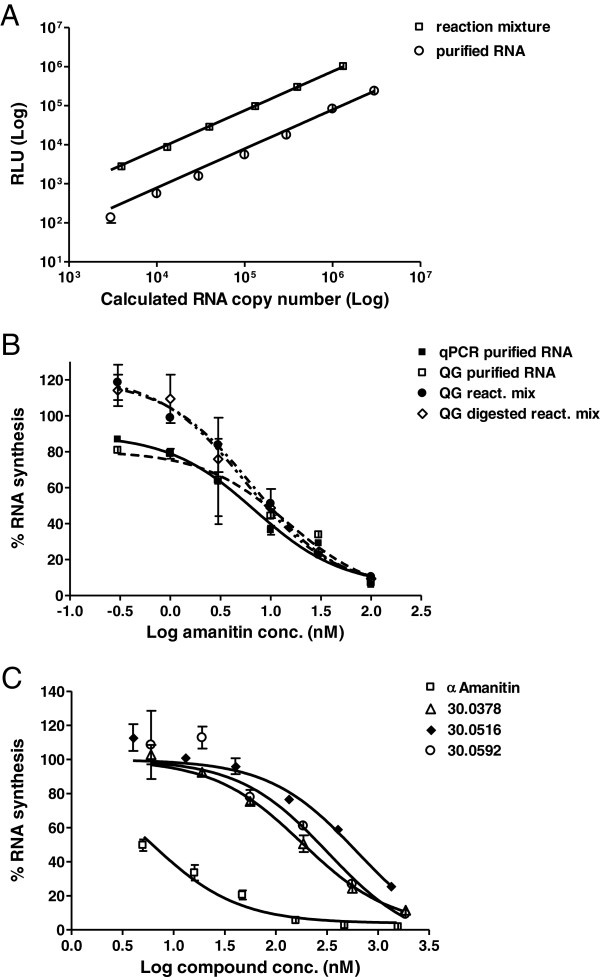
Figure 5.
Quantitative analysis of RNA synthesis by QuantiGene method. A &B: In vitro transcription reactions were performed using the linear, bead immobilized DNA template Bead-HS-DNA. Half of each reaction mixture was subsequently used for RNA cleanup and the RNA amount was analyzed by the optimized qPCR method. A. Dilutions were either prepared directly from the reaction mixture or from the purified RNA. Each dilution was assessed as a 4-fold replicate by the QG method. The chemoluminescence signals were plotted against the expected RNA copy number, showing a clear linear relationship. Error bars show standard deviation. B. The optimized qPCR method was used to quantitate RNA inhibition by α-amanitin as described in Figure 4. In parallel, purified RNA, diluted reaction mixtures or DNase-digested reaction mixture dilutions were analyzed by the QG-method. Percent RNA synthesis was calculated by relating the luminescence signals of the respective α-amanitin-reaction to the signal of the uninhibited reaction. The QG method provided clear α-amanitin-concentration dependency curves using unpurified RNAs directly from the reaction mixture. C. The QG-method was applied to compare the inhibitory activity of α-amanitin to that of three semisynthetic derivatives. Bars show the standard deviation of the duplicate samples.

