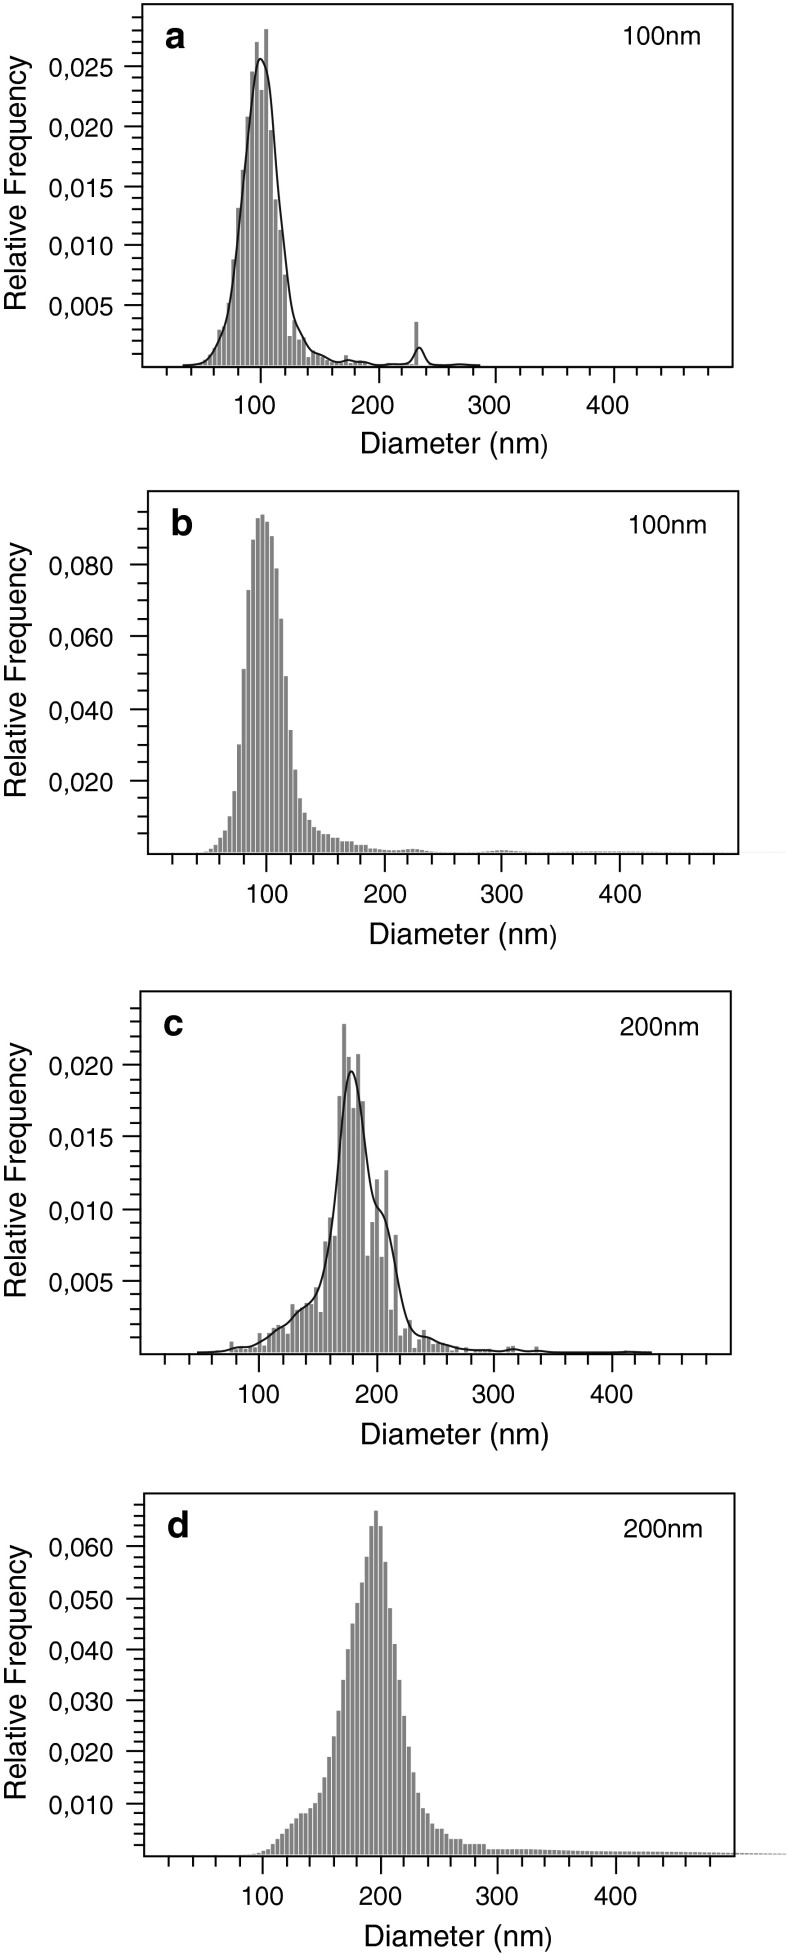
Fig. 1.
Comparison of NanoTrackJ and NTA using a 100 nm and a 200 nm NP suspension. Video sequences were captured with a NanoSightTM LM10 microscope and analyzed by NTA 2.3 (a, c) and NanoTrackJ (b, d). Because NTA 2.3 reports continuous size distributions, we added a kernel density estimate to plot a and c

