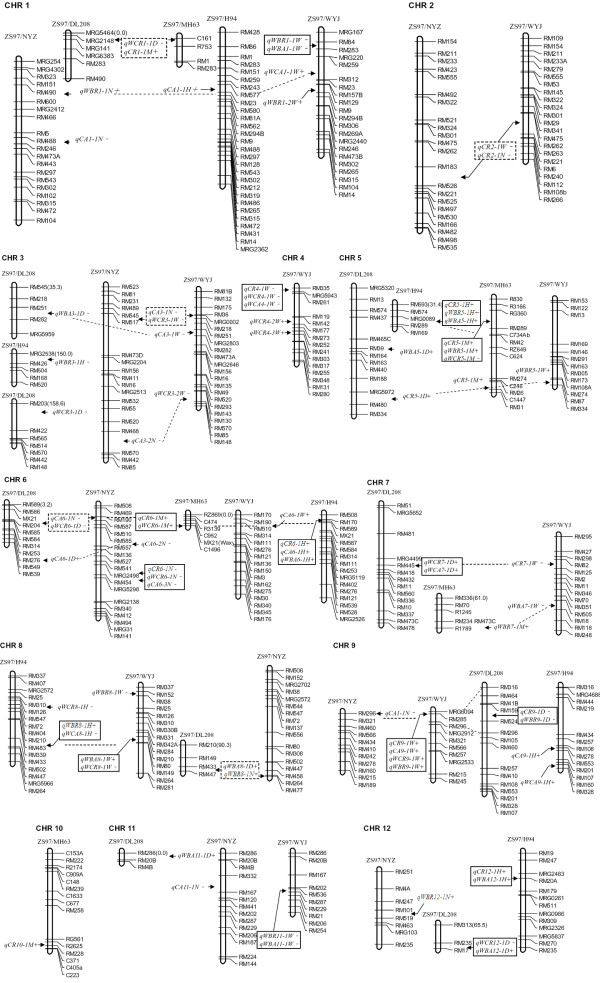
Figure 1.
The mapped locations of the integrated QTL profiles for the rice chalkiness traits in five populations. The QTL clusters are indicated by the panes or dotted lines; further the lines and dotted panes indicate the QTL cluster emerged after combination, while the solid panes indicate that the QTL clusters existed before combination.

