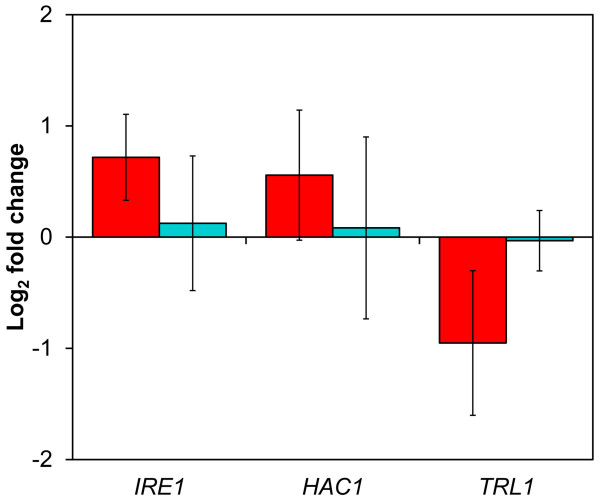
Figure 2.
Transcriptional response of genes involved in the regulation of the UPR. Bars show the log2 fold change of the indicated genes during a transition from aerobic to anaerobic conditions in a XR/XDH-strain utilizing xylose (red bars) or glucose (turquoise bars) as carbon source [27]. Values are given as mean fold change of two independent measurements in each conditions and errors represent the 95% confidence interval of the mean (df = 2).

