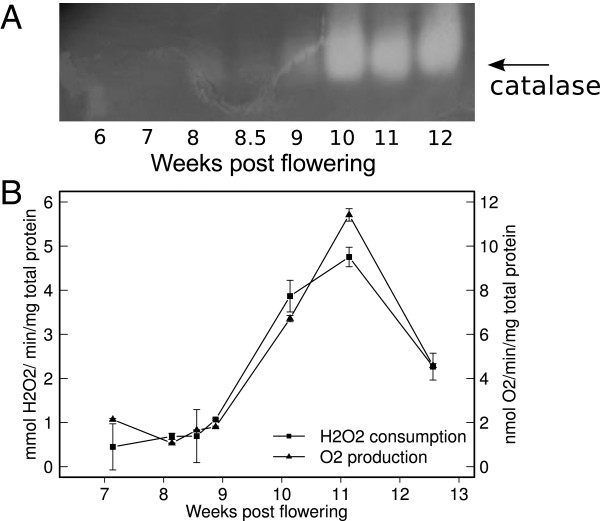
Figure 3.
Catalase activity during Pinot Noir berry development. Native protein lysates were obtained from berry skins sampled at the indicated time points. A: Zymogram of catalase activity using 50 μg total proteins per lane. B: Catalase specific activity measured in vitro by determining either H2O2 consumption (absorbance at 240 nm) or O2 production (in-line O2 recording using direct injection MS). Data are means of biological duplicates ± se.

