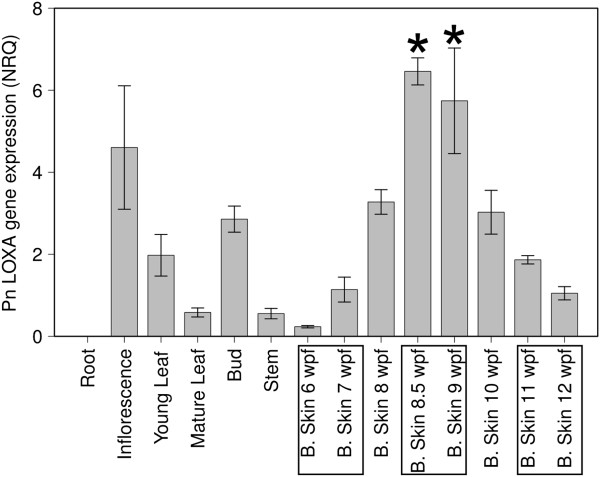
Figure 8.
PnLOXA gene expression in grapevine tissues and in berry skins along development (6–12 wpf). Normalized relative quantities ± se were calculated using three reference genes; n = 3. PnLOXA expression at véraison (marked by asterisks) was significantly different from pre-véraison (6-7 wpf) and ripening (11-12 wpf) as assessed by ANOVA and Tukey HSD test (p < 0.01).

