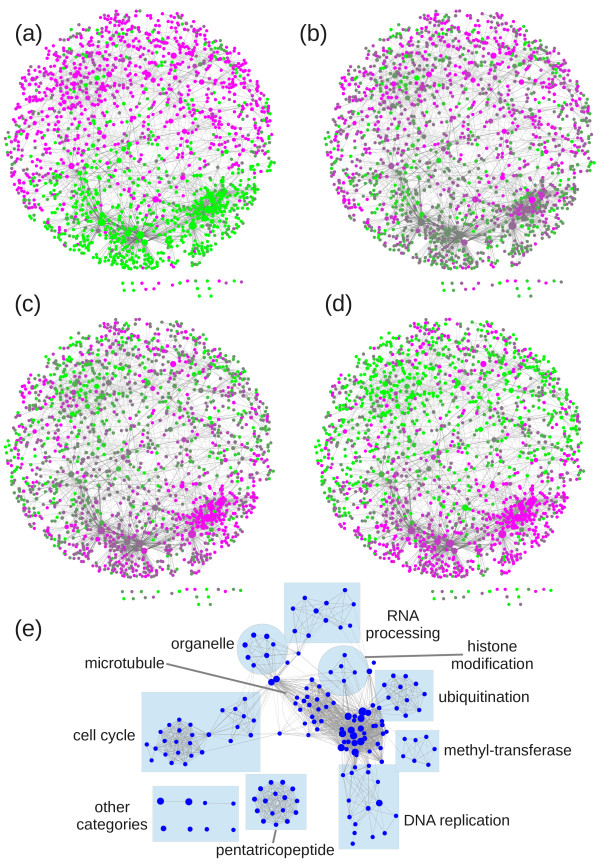
Figure 2.
Subnetwork of differentially expressed genes in a SHR induction time-course [30]. Node colors correspond to down-regulated (green) or up-regulated (magenta) genes at 1 hour (a), 3 hours (b), 6 hours (c) and 12 hours (d) after SHR induction. (e) Enrichment Map [72] network of category enrichments calculated with David [70,71] for genes in the subnetwork that switch from a down-regulated to an up-regulated status during the induction kinetic.

